
Viking's FX-Basket Update #29
A blessed weekend where both the old and new week as well as month meet, perfect for long term basket charts. JPY, GBP, CHF, CAD, AUD, NZD & EUR

So, this is one of the blessed weekends where both the week and month ends and starts afresh, making it a perfect time for another FX-Basket update.
JPY
Starting with the Yen and I will give you two monthly chart counts, the only ones that are available in my view - unless JPY is to collapse totally intends to break the rules.
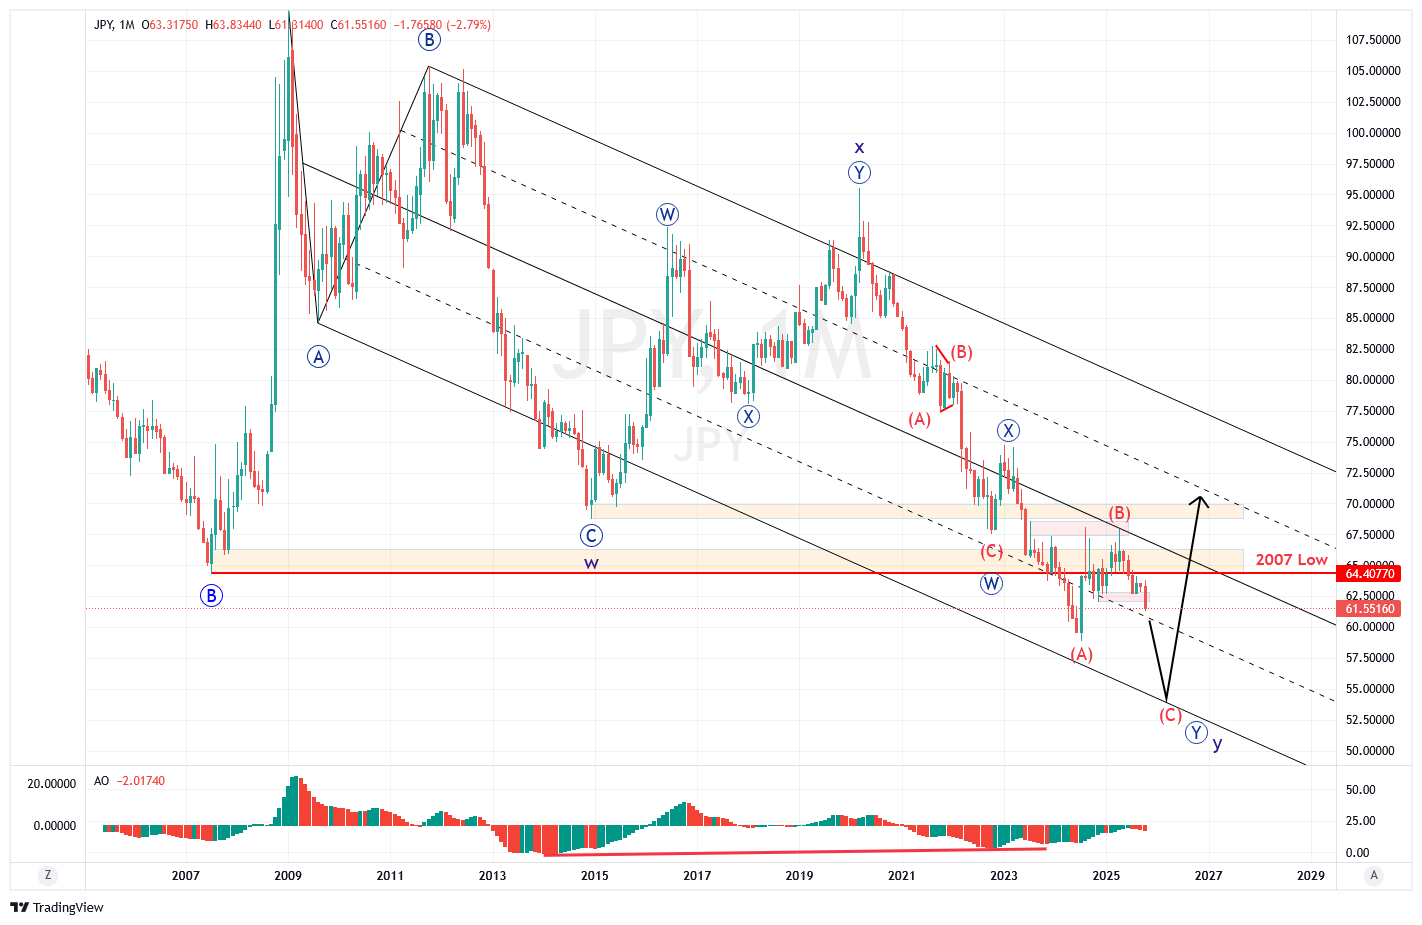
The red box in the count below marks a overlap between 2009 low and 2020 high, forcing a corrective count, as it sanely can’t be counted as a diagonal.
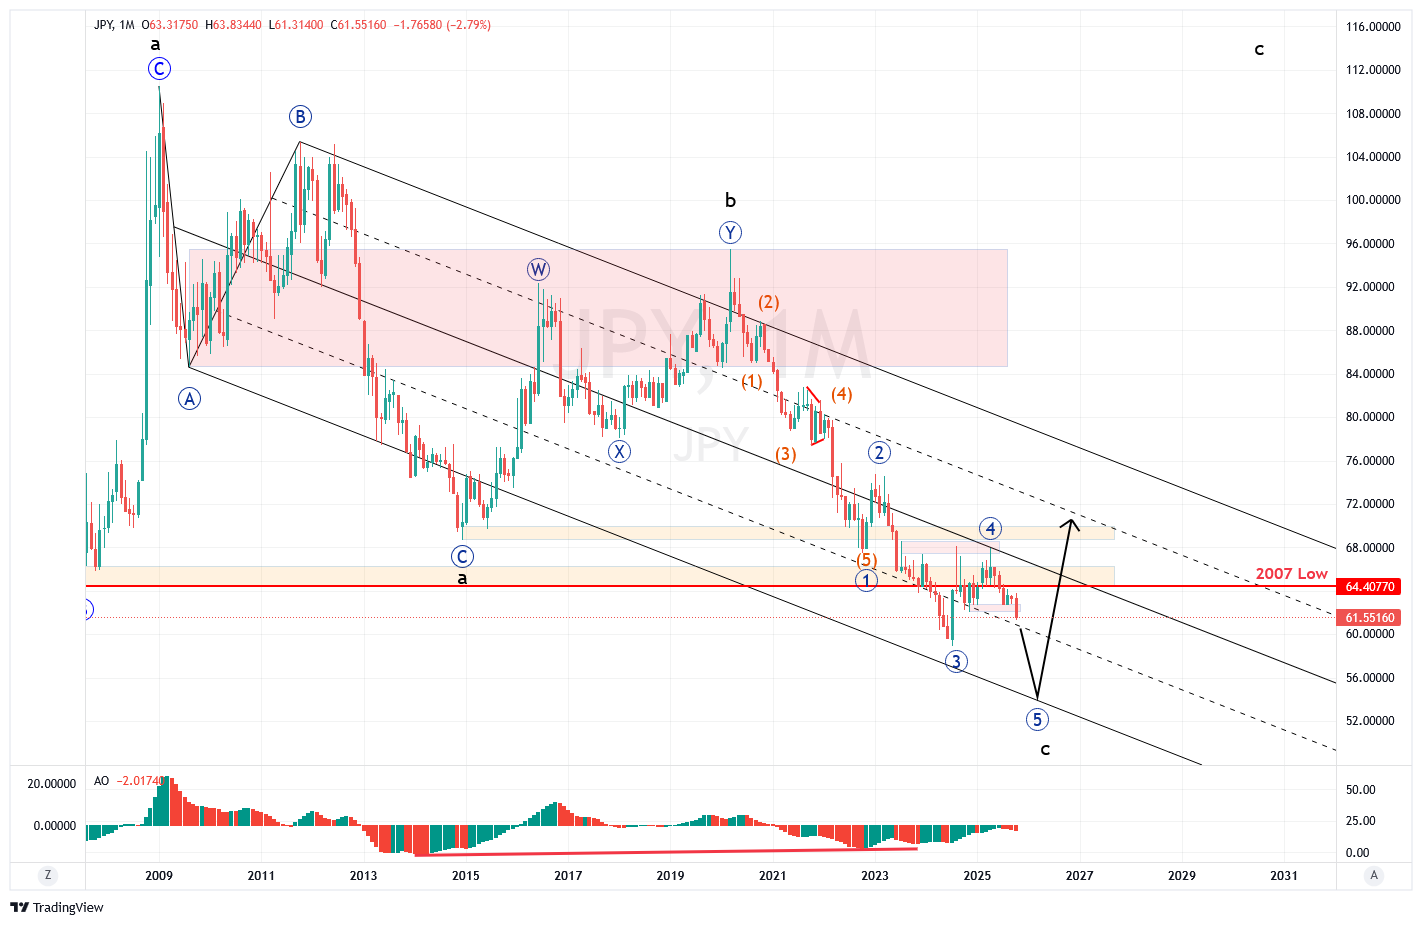
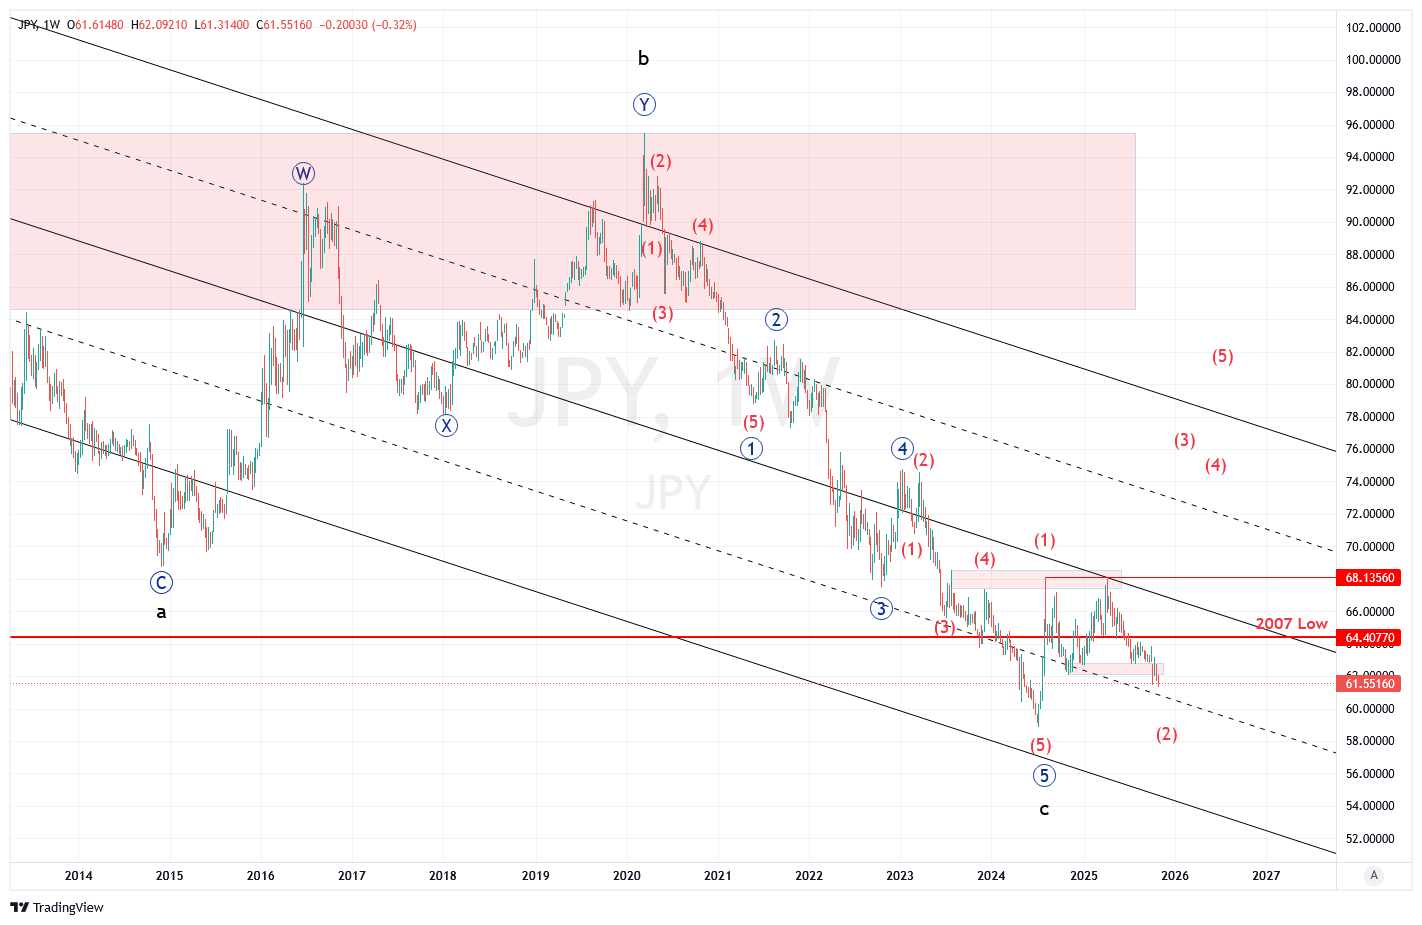
A common factor in both the above charts is the expectation of a last wave in 5 subwaves, unless the last low made in July isn’t the low after all? So let’s examine that.
The only count available, which wouldn’t break the no. 1 rule of EW (wave 3 can never be the shortest wave), is the one below.
It completes the last wave 3 in 5 subwaves, but do I have confidence in this count? Not really, but it is possible even if some of the sub waves are questionable. Like, blue 2 is very shallow, just short of 23.6%, blue 4 is very sharp and not easily counted in 3 subwaves. Moving wave 3 to the left would solve that, but… it would make 3 the shortest. Further, red (4) is odd but possible.
In any case, I would expect more weakness going into year end and then we will see. Of course, the Yen will spring to life now and then as a result of hawkish BOJ rumors etc. but at the end of the day, BOJ will do as the Gov directs as BOJ certainly isn’t a independent CB, despite what’s said publicly.
GBP
The Pound, after having a vigorous rid from the 2022 low, has been struggling lately and zooming out to the Monthly chart it can be clearly seen why. There is a strong supply zone, created 9 years ago during the Brexit sell-off.
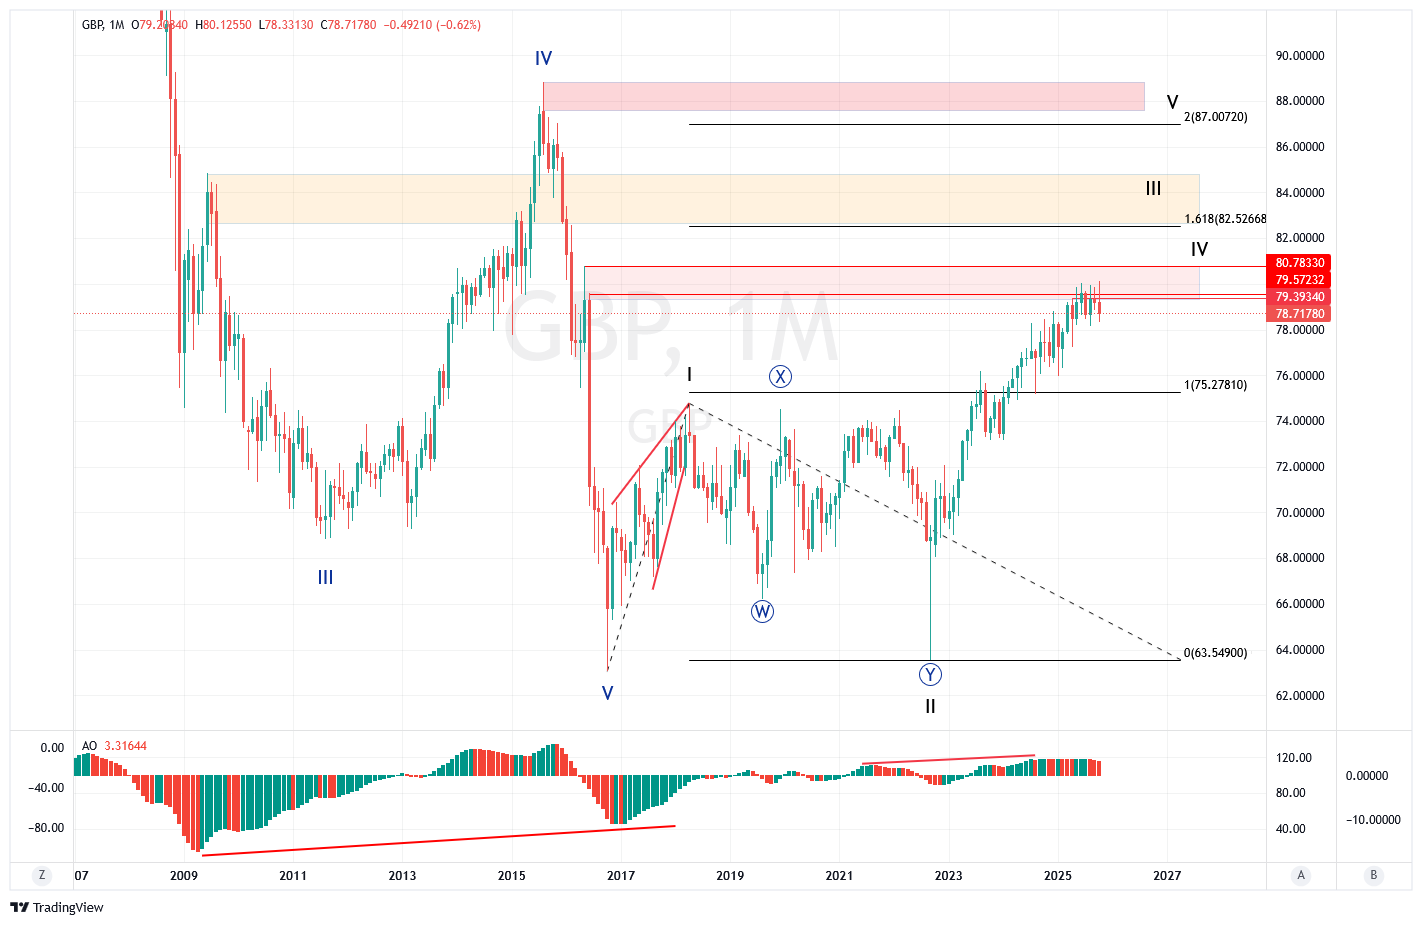
So it really makes sense that GBP has been knocking on this roof of resistance the last 6 months and the fact that it hasn’t really sold off from there is a sign of strength in my view. Of course, on lower time frames it may look less “bullish” but that’s why it’s so important to not get stuck down there but to take the step back now and then to get perspective.
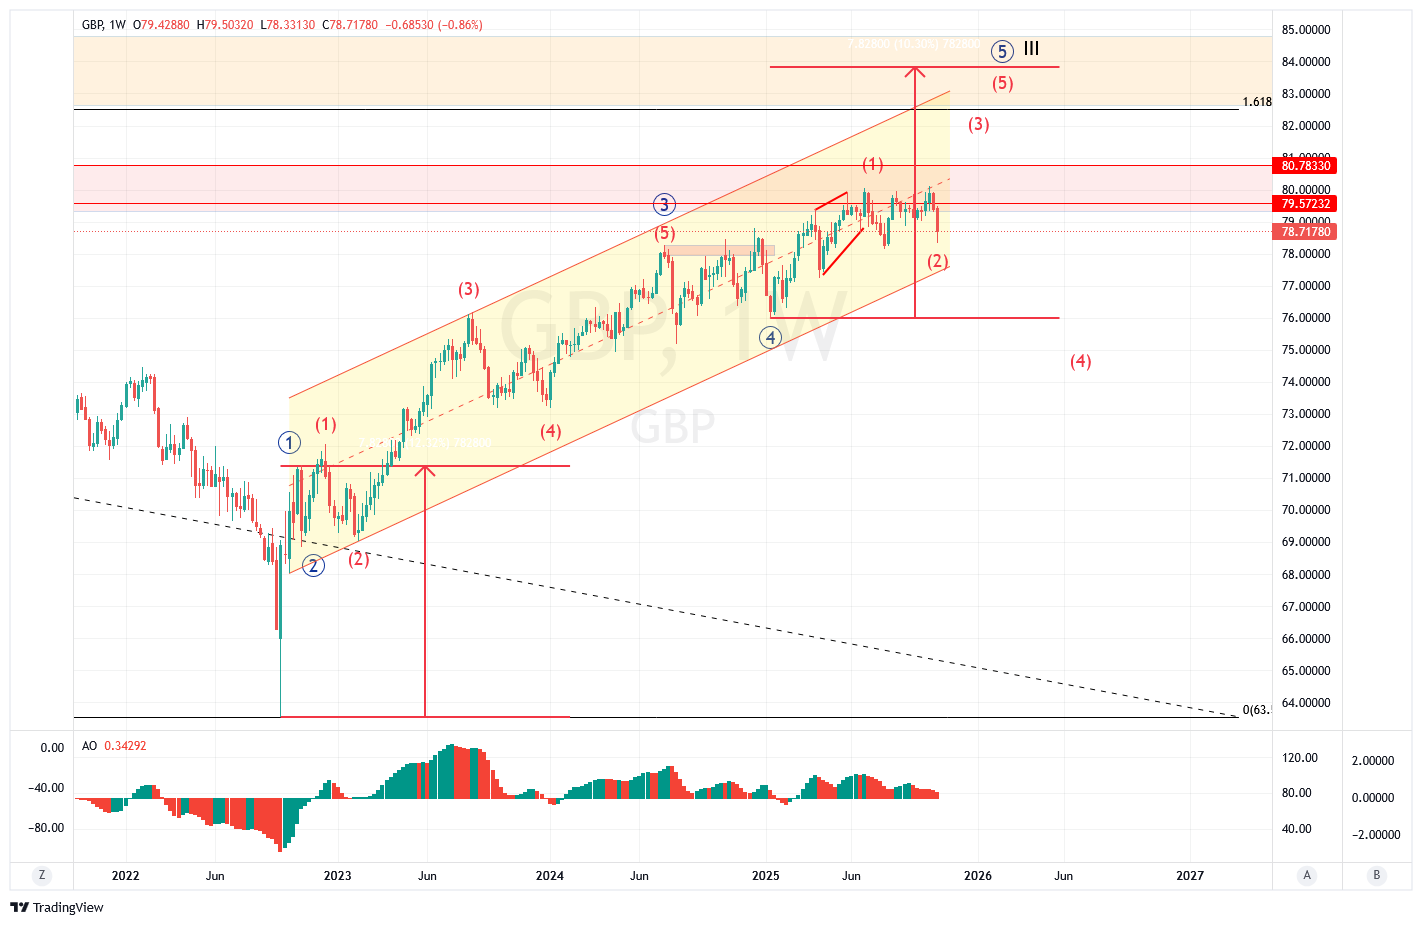
Stepping down to weekly gives more detail but not that many clues about if it will be done here soon. Obviously, some kind of catalyst will be needed to push it above resistance. Could it be the upcoming UK budget release in November, which few seems to expect something good from, so it could be it. A push lower to blue wave 4 is of course also a possibility but time will tell.
In any case, I don’t think upside is completed here just yet, just delayed at worst.
CHF
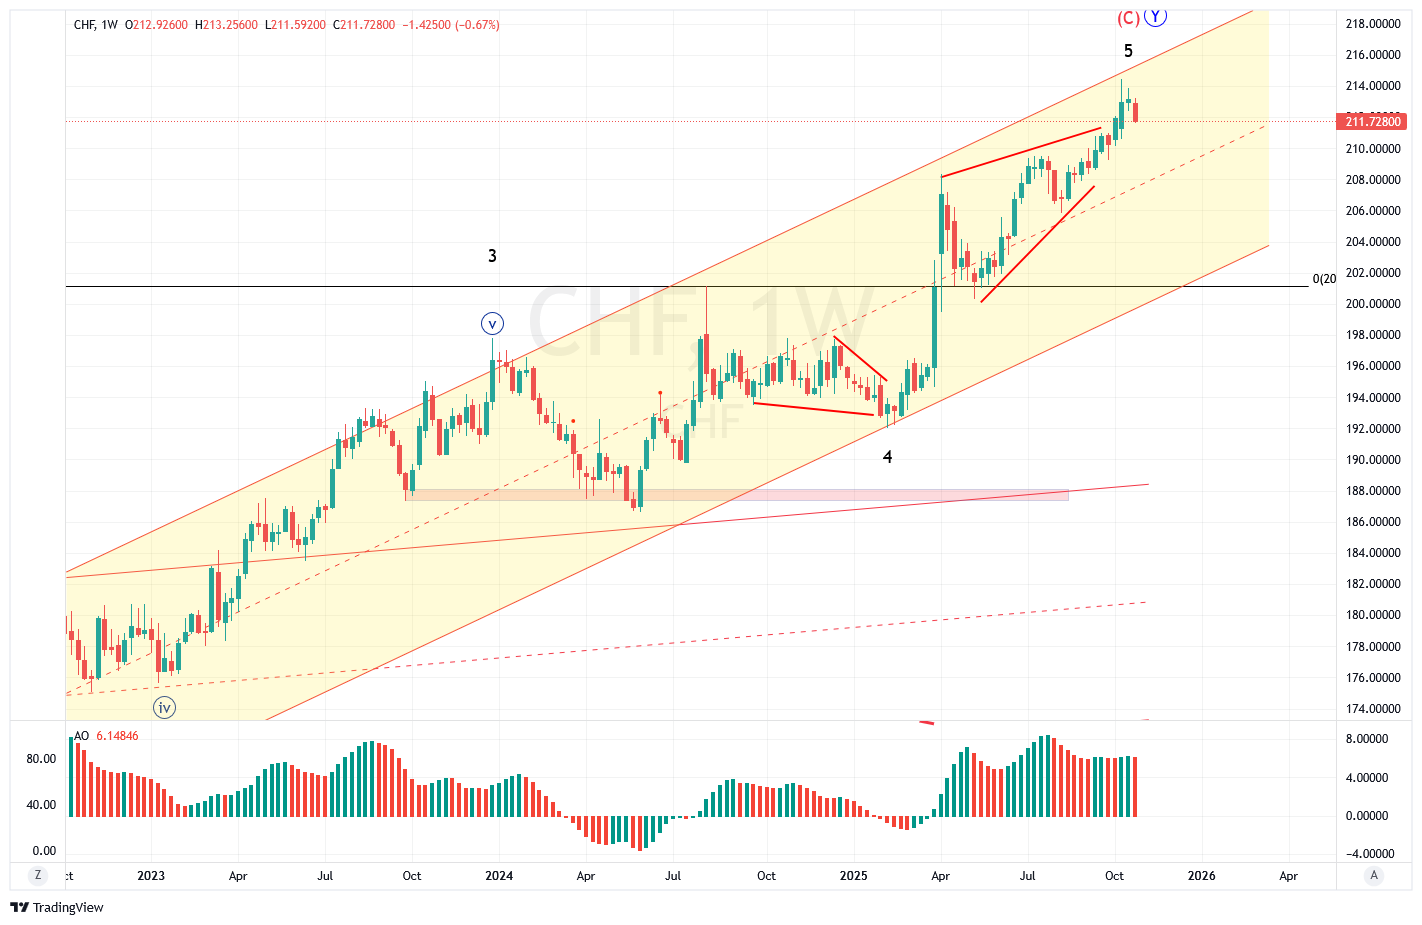
Each time I look at the Swiss Franc monthly chart I’m perplex and astonished, and yes, I have called it several time as it has kept on denying the laws of gravity. The funny thing is, one may think, that this whole structure can’t be counted as an impulse, no way. However, here is the thing with corrections they can just go on, and on, until the underlying reason is dissolved and in the case of the Swissy that seems to be a tricky issue to resolve.
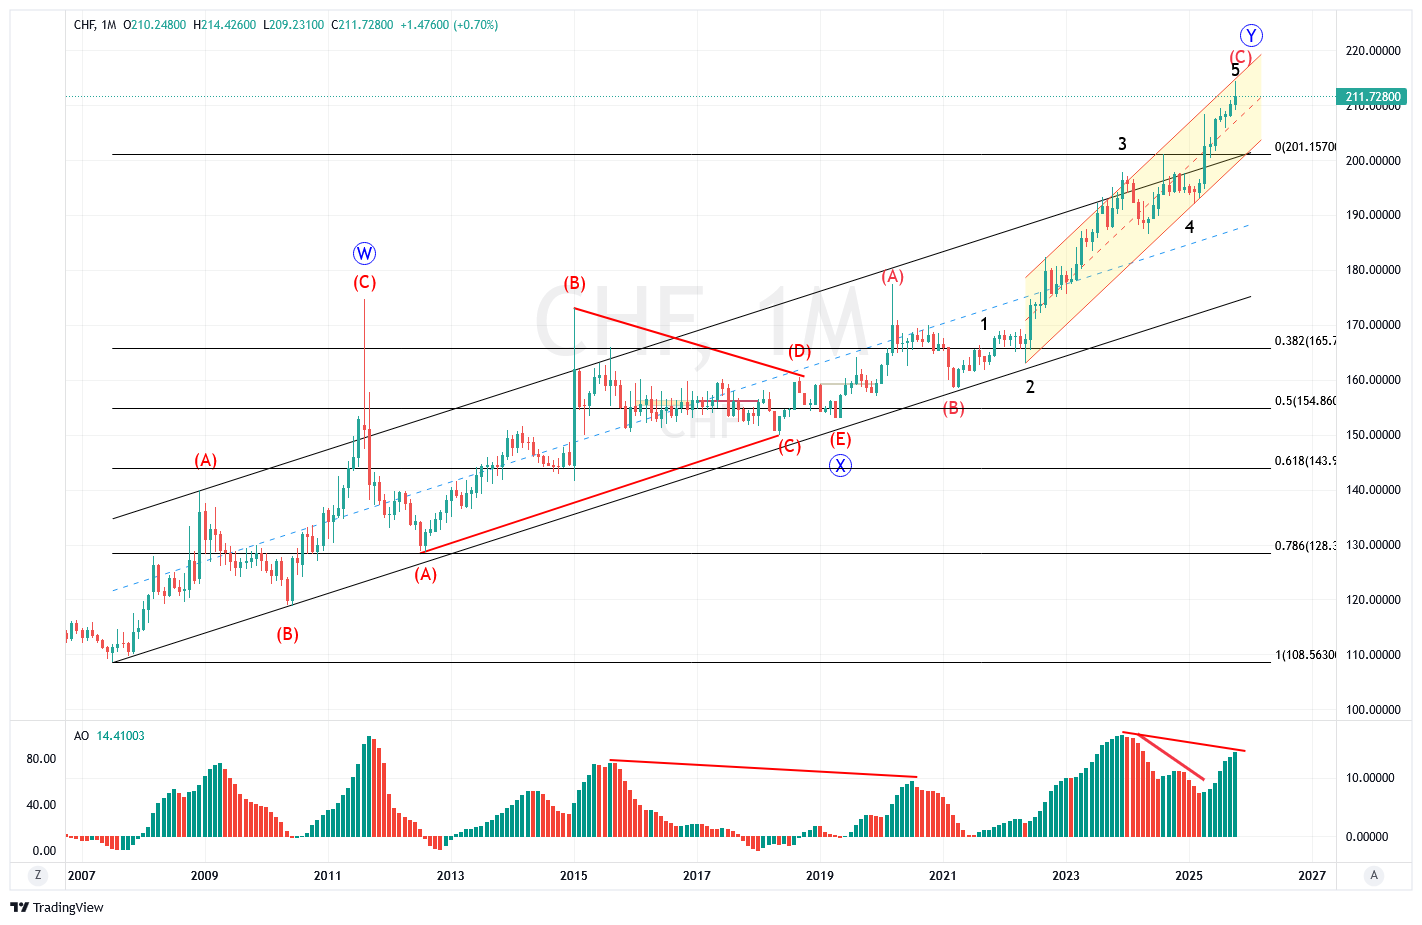
From a technical perspective, this chart is really ready to rip in the other direction but will the October rejection be strong enough to do it? I have no idea but why not.
CAD
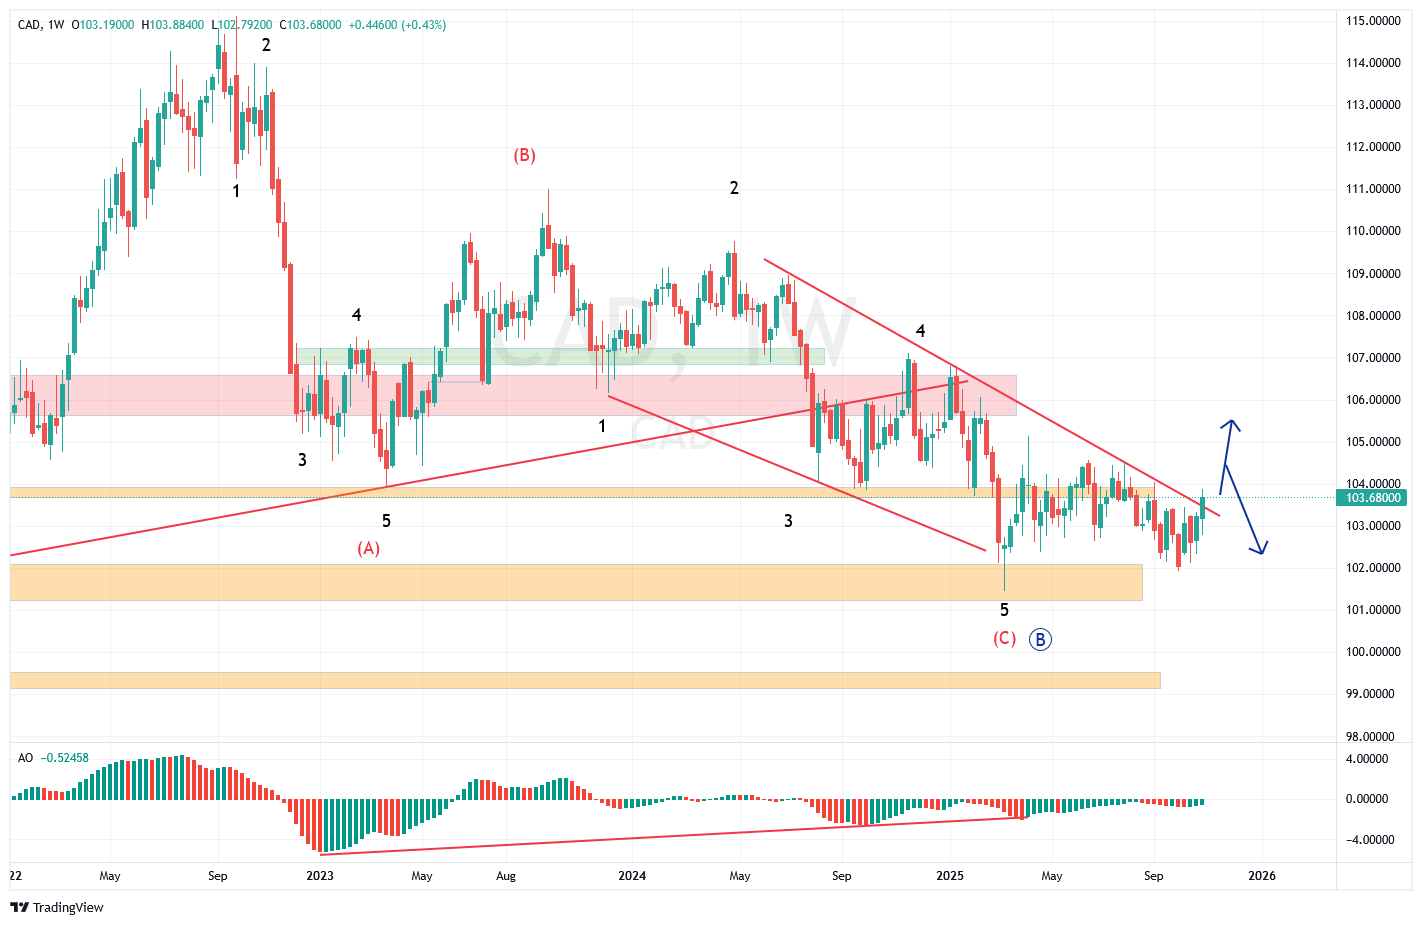
I have been waiting for several months now, for the Loonie to confirm an ending diagonal as wave (C) or blue B but it has done nothing of the sort. It hasn’t collapse below support either and if anything, October has gone in the right direction and may even turn out to be the green light for it to finally happen.
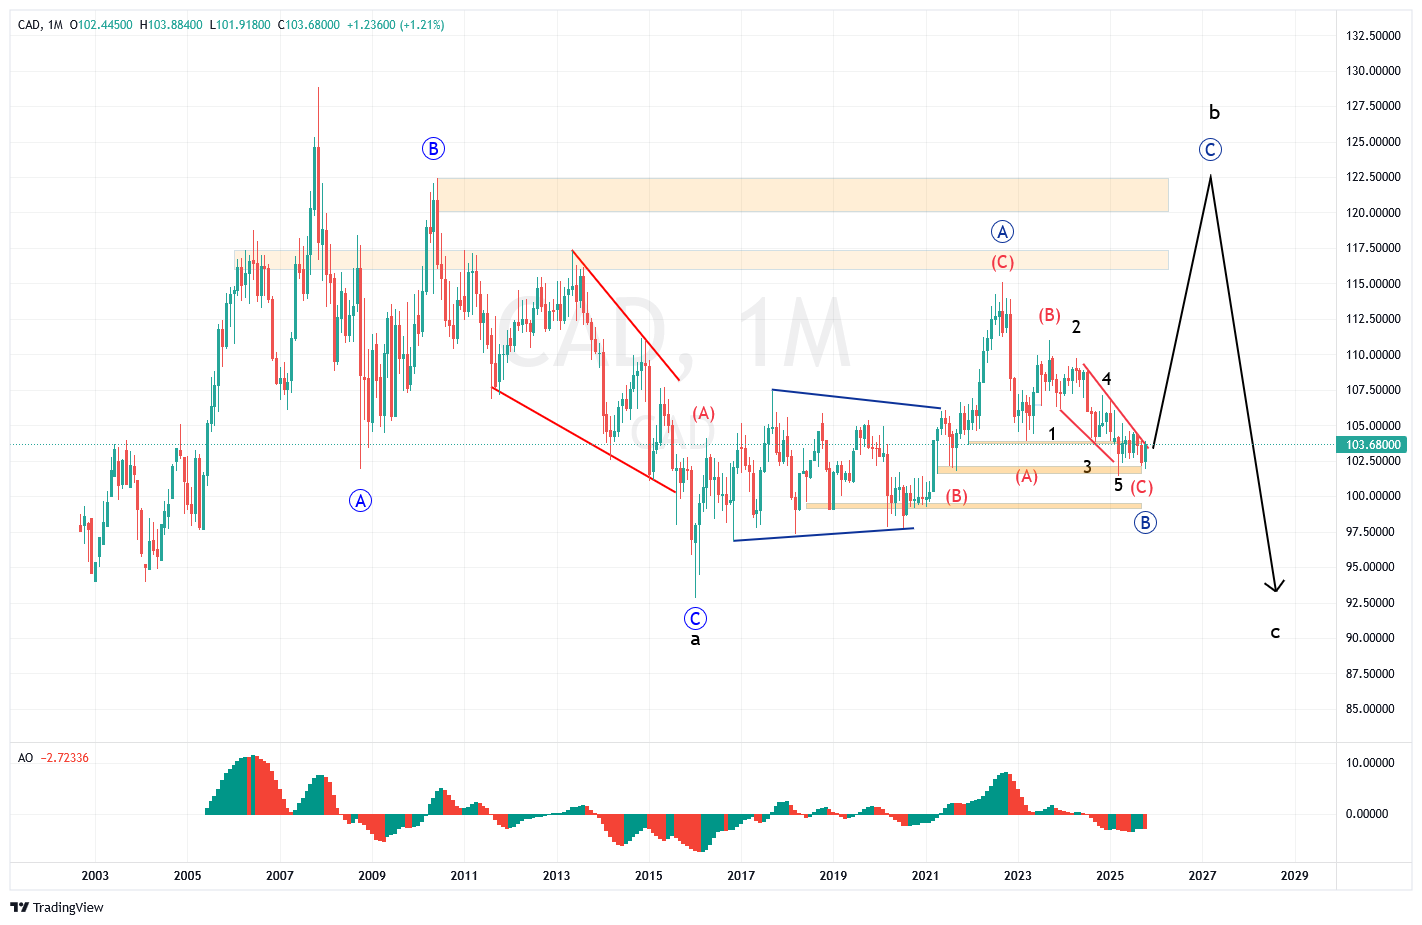
At the moment, we can only wait and see how the new month will open up and it sure has something to prove still, but as long as it stays on the right side of that trendline there is hope. However, we can’t trade on that.
AUD
The correction I expected for the Aussie, never came to be or at least not so deep as expected. So does it mean it’s all plain sailing ahead for the King of Risk? Well the monthly chart leaves bind an interesting impression, where the goal seems to be the neckline of a huge Inverted H&S pattern.
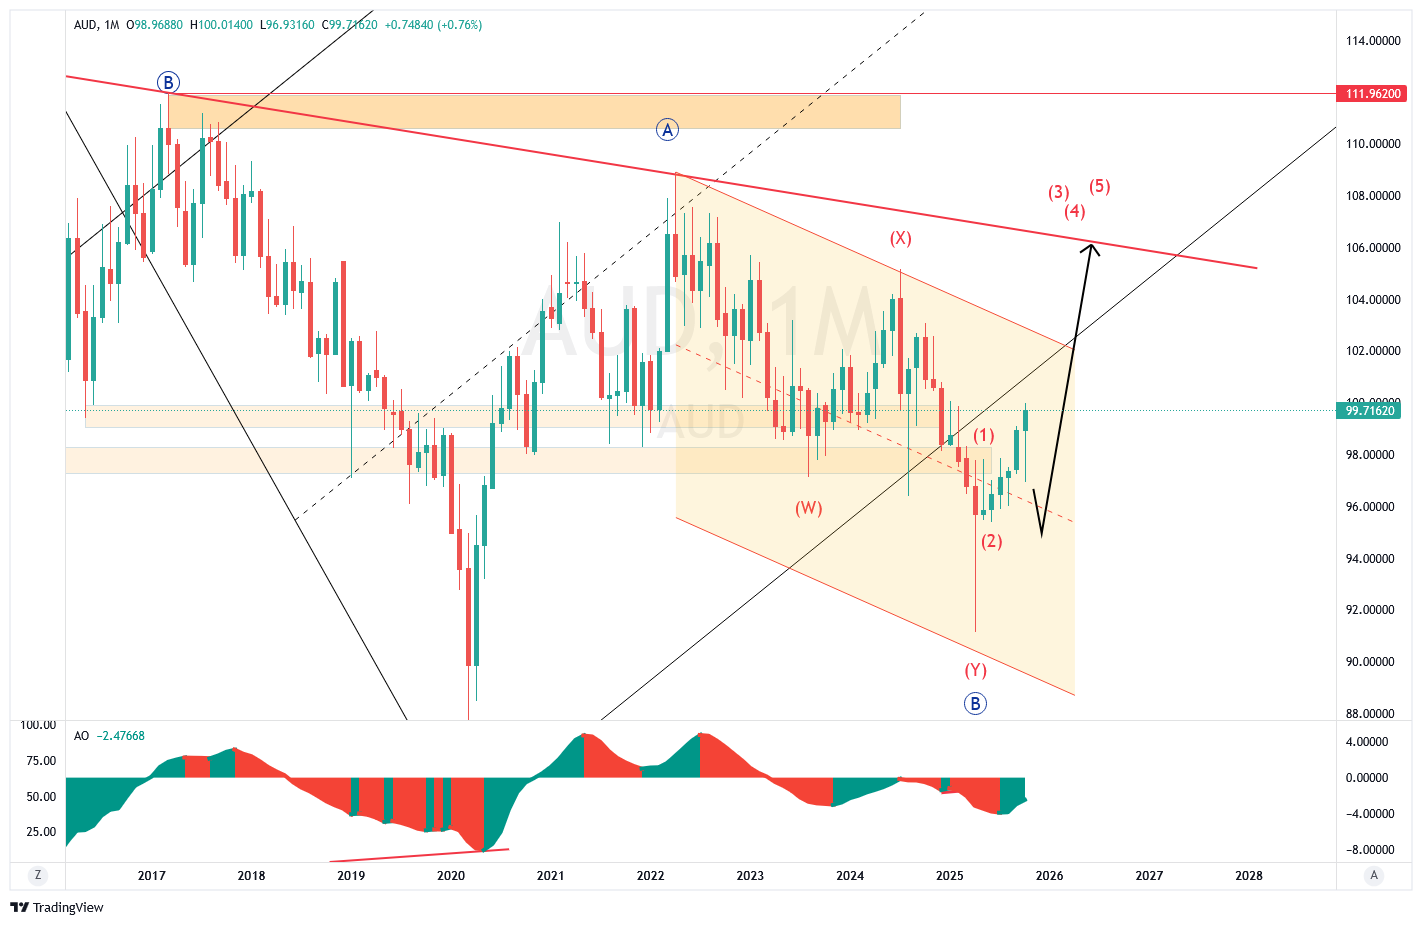
If it will be realized is of course another question, but stepping down to the weekly chart there is some ground for such development. Instead of the deeper correction I expected earlier, we have now got 3 overlapping but impulsive looking waves, potentially setting up a (1)-(2),1-2, i-ii catapult for an extended wave (3), where a x1.618 expansion of wave (1) would land just about there.
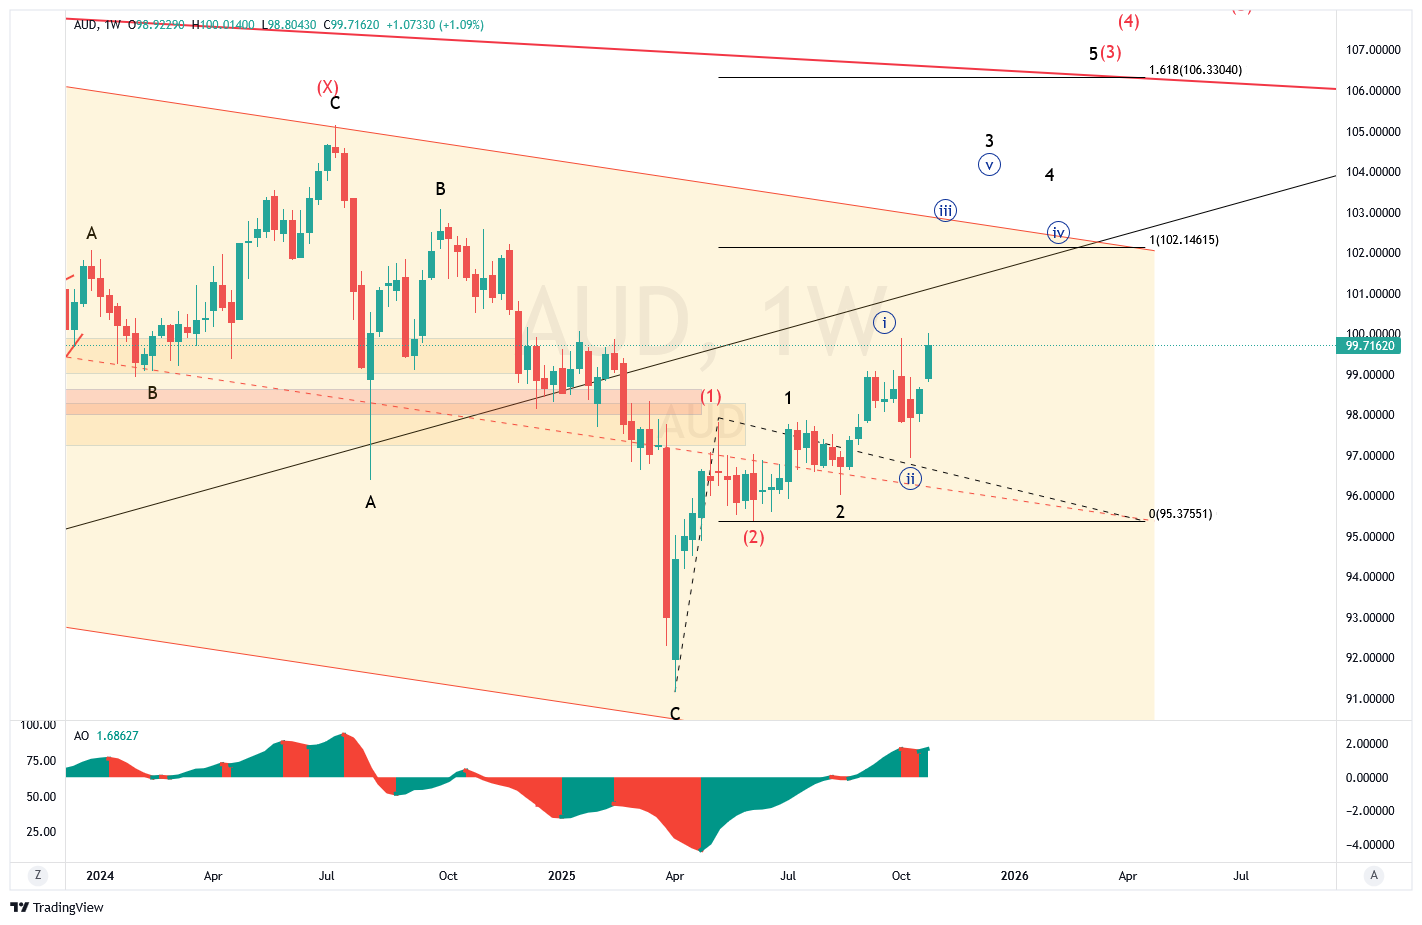
Last week saw some positive news for risk fx, but there are also some clouds of worry or hesitation, that seems to have hold back thing more generally, despite the nicely green weekly candle here. Let’s see what November will bring.
NZD
The Kiwi certainly lived up to the expectation of a deeper pullback since the June high, to a large degree driven by excessively high cut expectations from the RBNZ, but October seems to have put a dent in that correction. Of course, part of that comes from higher than expected CPI readings in NZ, so maybe RBNZ will be more cautious with the cuts now.
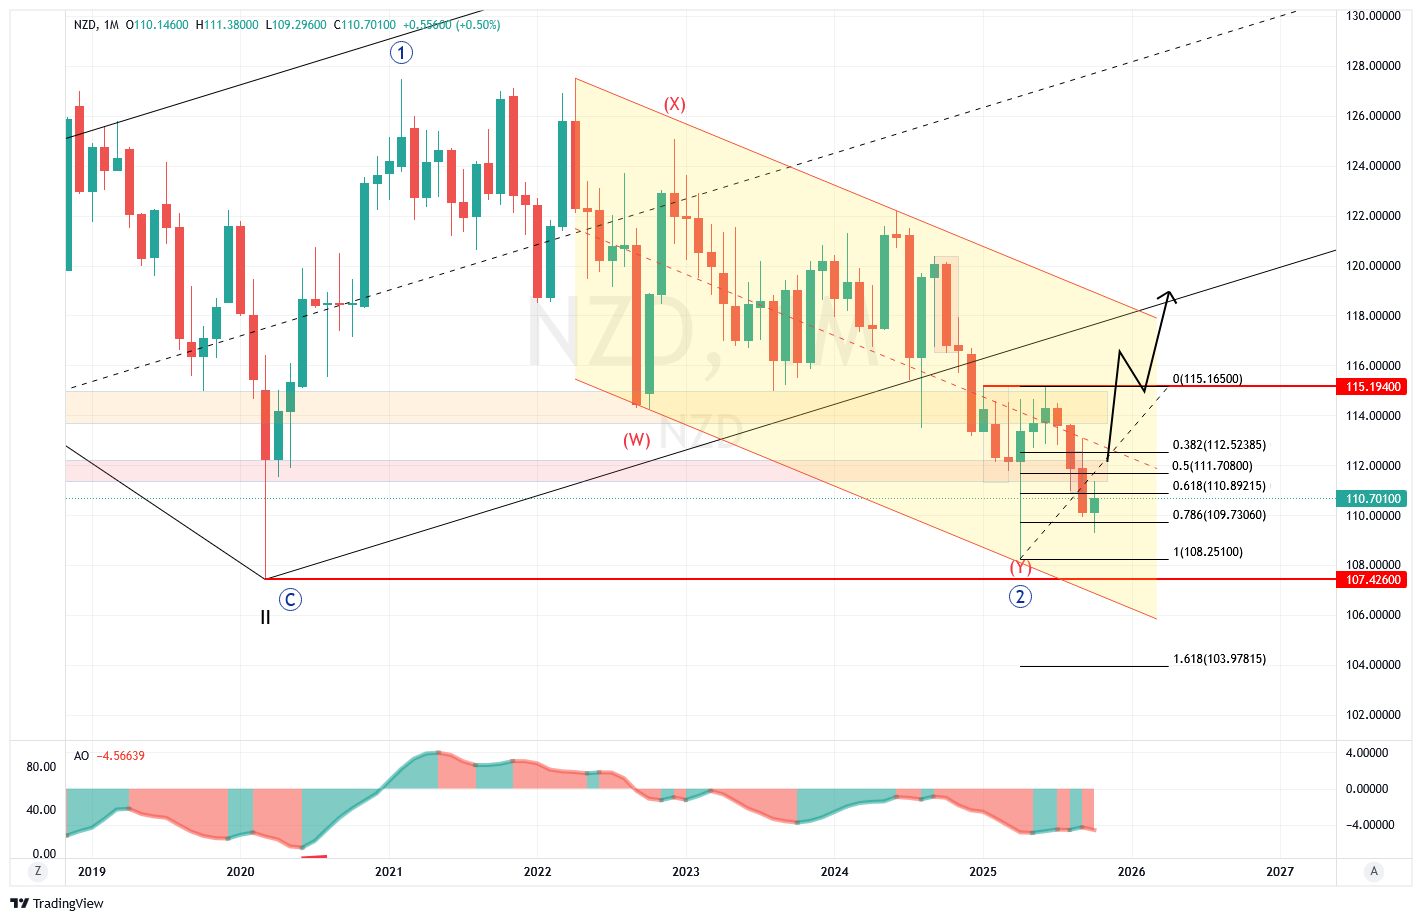
A more benign risk picture would also lift NZD further.
EUR
The Euro has now basically reached where I expected it to go, ending a triple WXYXZ combination in a Monthly channel.
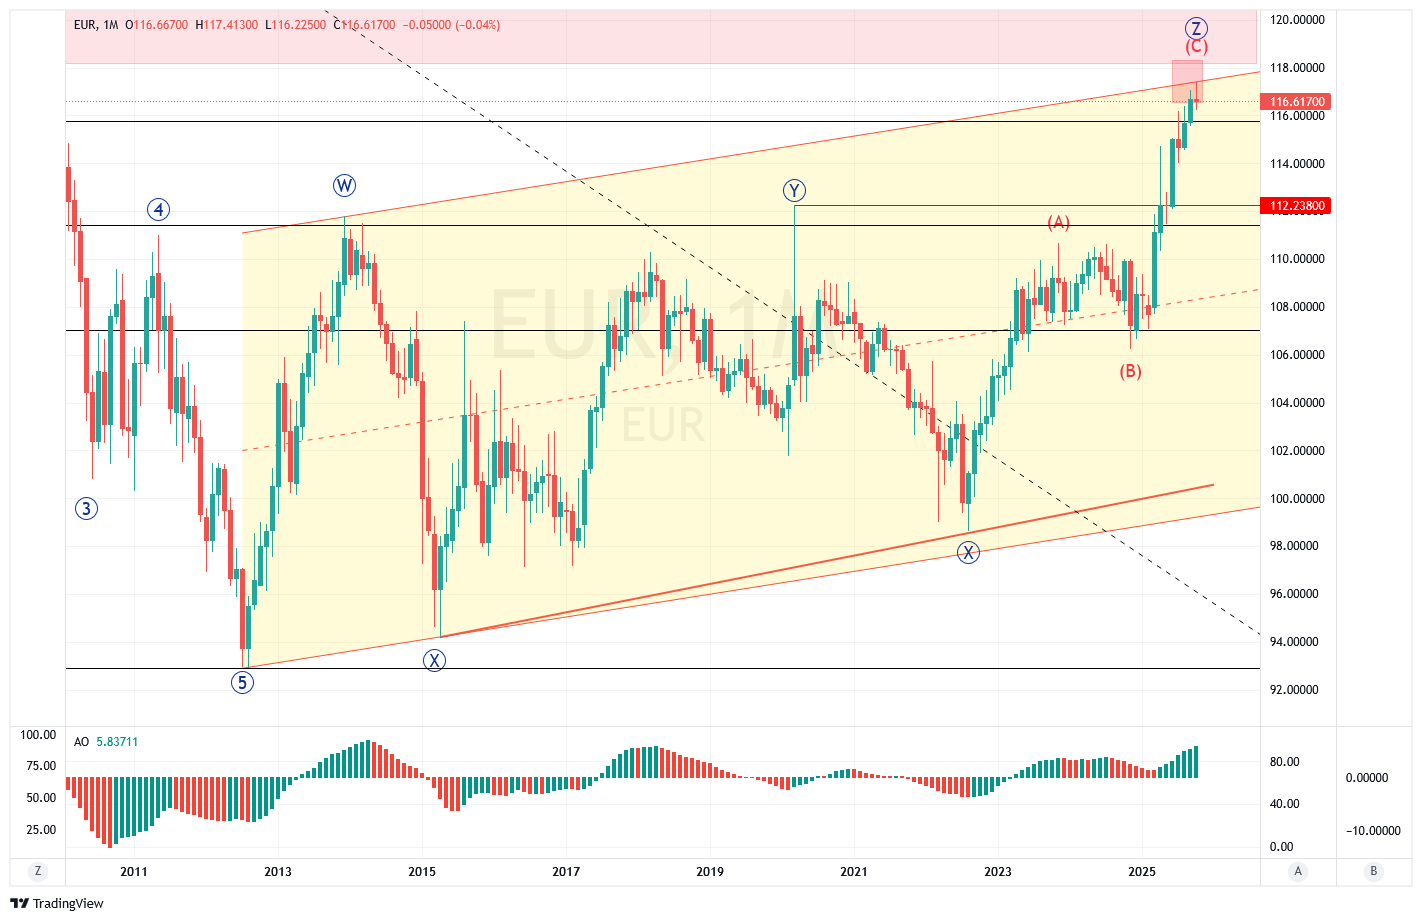
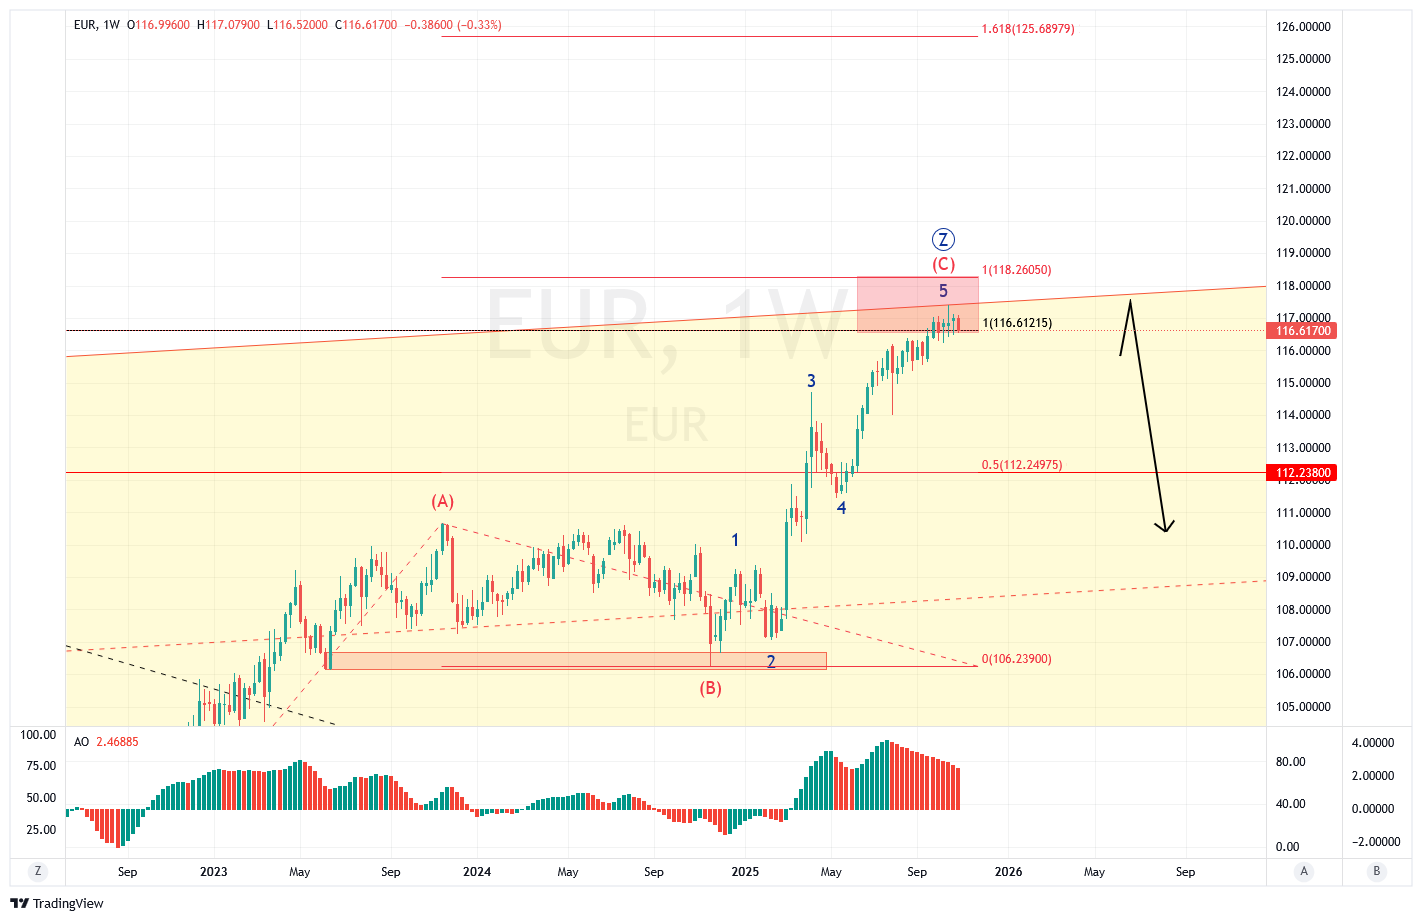
Not many words needed here, as we also can see on weekly chart that it’s pretty much in the middle of the zone I have drawn months ago.
If we go all the way down to Daily, it can be seen that EUR may still have one wave left to the upside, although it’s ambiguous and unclear. Next week will probably reveal if it’s the case.
USD & DXY will be looked at in a separate post.