
Viking's FX-Market Update #11
Did Powell change the direction for USD with his hawkish talk, or was it a scared dove dressed in hawk feathers we saw? DXY AUDUSD EURUSD GBPUSD USDCAD USDCHF USDJPY

So here we are again with a shared end to both Month and Week, giving us the perfect opportunity to look at the bigger picture without it running away from us. Of course, I would like to have time to look at everything but will fall back on the US Dollar once again as it after all, still is the King of the Fiat show.
DXY & USD Basket
I have explained in the past, the difference between the DXY and the USD basket, so won’t go into that once again. In short though, they are different but similar and sometimes they may bring confluence, other times a signal of warning etc. as it’s a bit like looking at the same painting but from different angles.
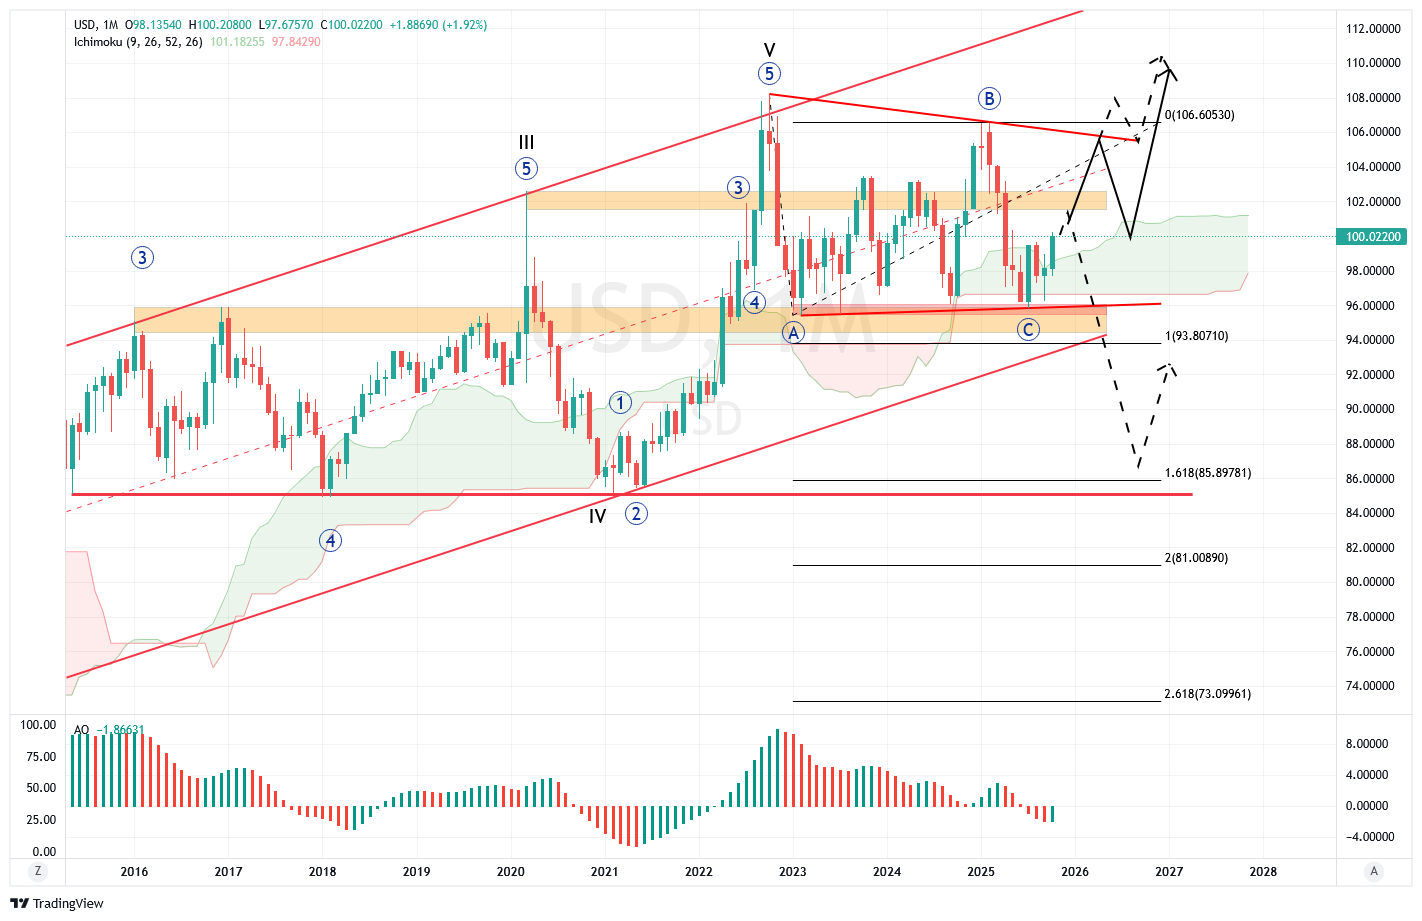
The USD Basket often offers an alternative count compared to the DXY, which can be seen in the Monthly charts above and below. While I have plotted three different paths for the Basket above, I think the one suggesting a triangle is the most likely to play out. I base that partly from strong performance during Sep-Oct, in response to a Double Bottom reversal with the July candle.
Partly, I also hold this view based on the USD’s interaction with the Ichimoku cloud, both in a historical and present context, plus that the price action since the Oct-22 high has been symmetrically contracting. From this I would say, there is a lot pointing to that the USD may have bottomed already.
What makes me hesitant in that view, however, is Powell’s imposed “hawkishness” at last FOMC presser, which I see as absolutely nonsense and bollocks because he had and still has no idea there things reside due to lack of data, so what he said was nothing more than a play of words, to say “we are data dependent and sets rate meeting to meeting” in a more fancy way. That’s why I think the greenback could still go much lower indeed.
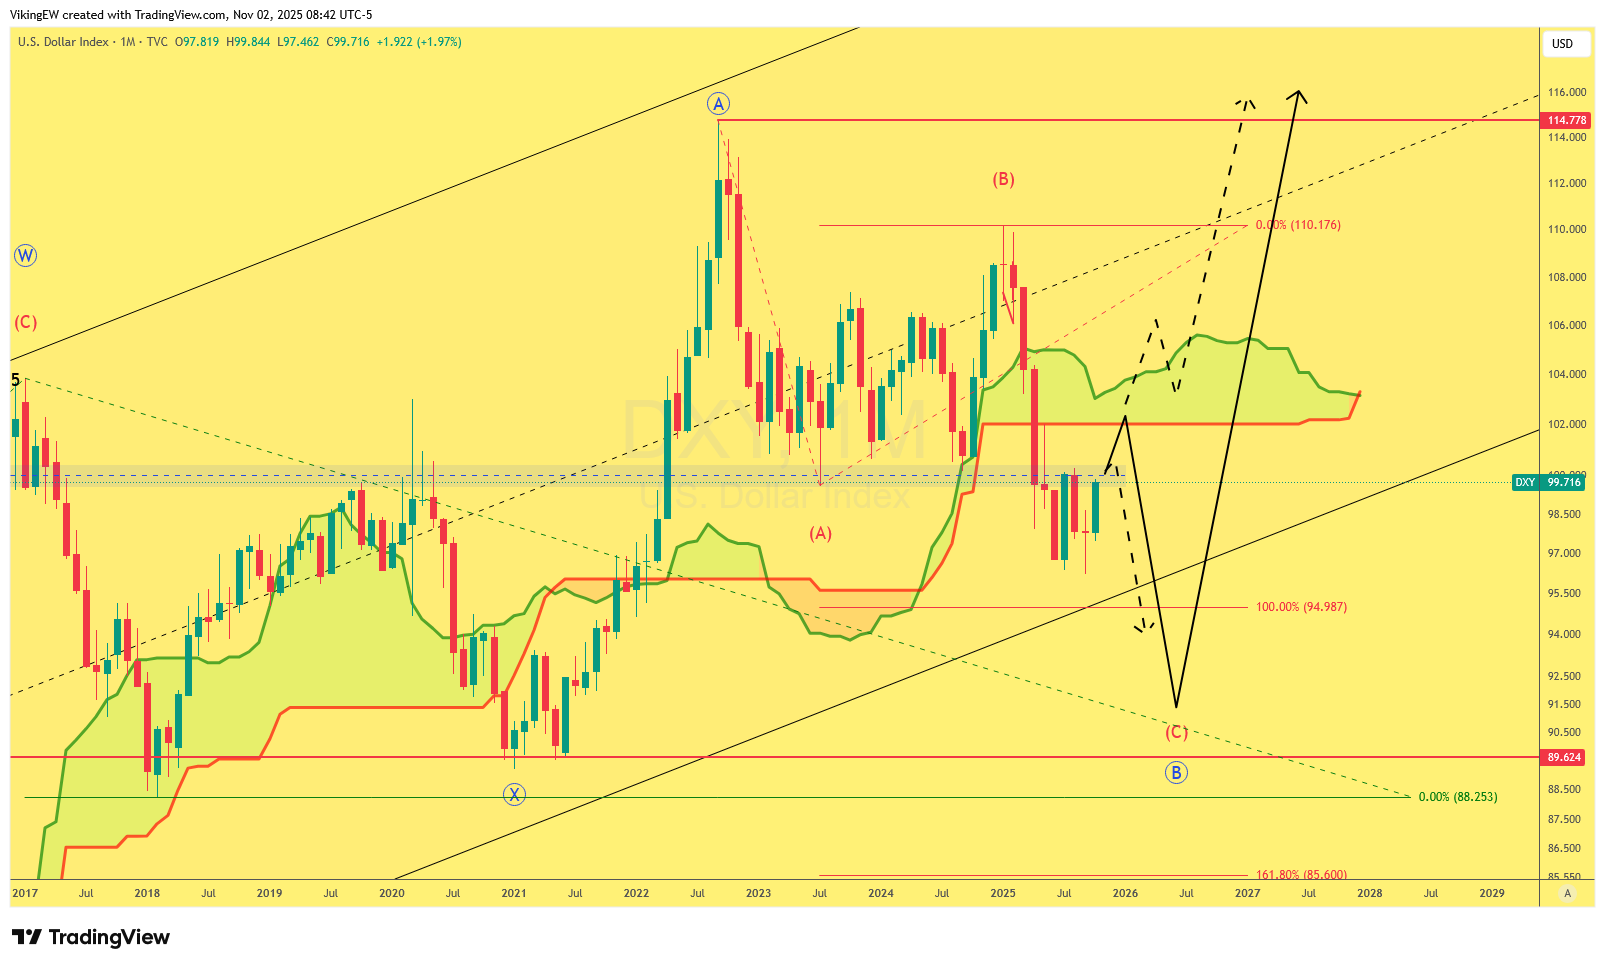
We can also see more support for this idea in the Monthly DXY chart, which in some sense is a contradiction to the Basket as here the resistance above is more accentuated, compared to the support below in the basket.
A lot of this has to do with the Euro, of course, as it constitutes some 57% of the index, plus another 13% for the Yen and the reason why the DXY still has such a big sway on the greenback, is because those currencies are traded with a much higher liquidity than the others. So where does it leave us? Well, no one can look into the future and tell with higher certainty what will happen, but short term there is at least an indication here of a stronger USD generally, until it hits the resistance zones marked on both these charts. Of course, we need to look at the individual pairs for more detail and to see where the best opportunities may wait.
AUDUSD
As I have pointed out several times in the past, AUD is not included in the DXY index, which is the reason why this pair still can be bullish while DXY pushing higher at the same time. So there is no help to get from that side.
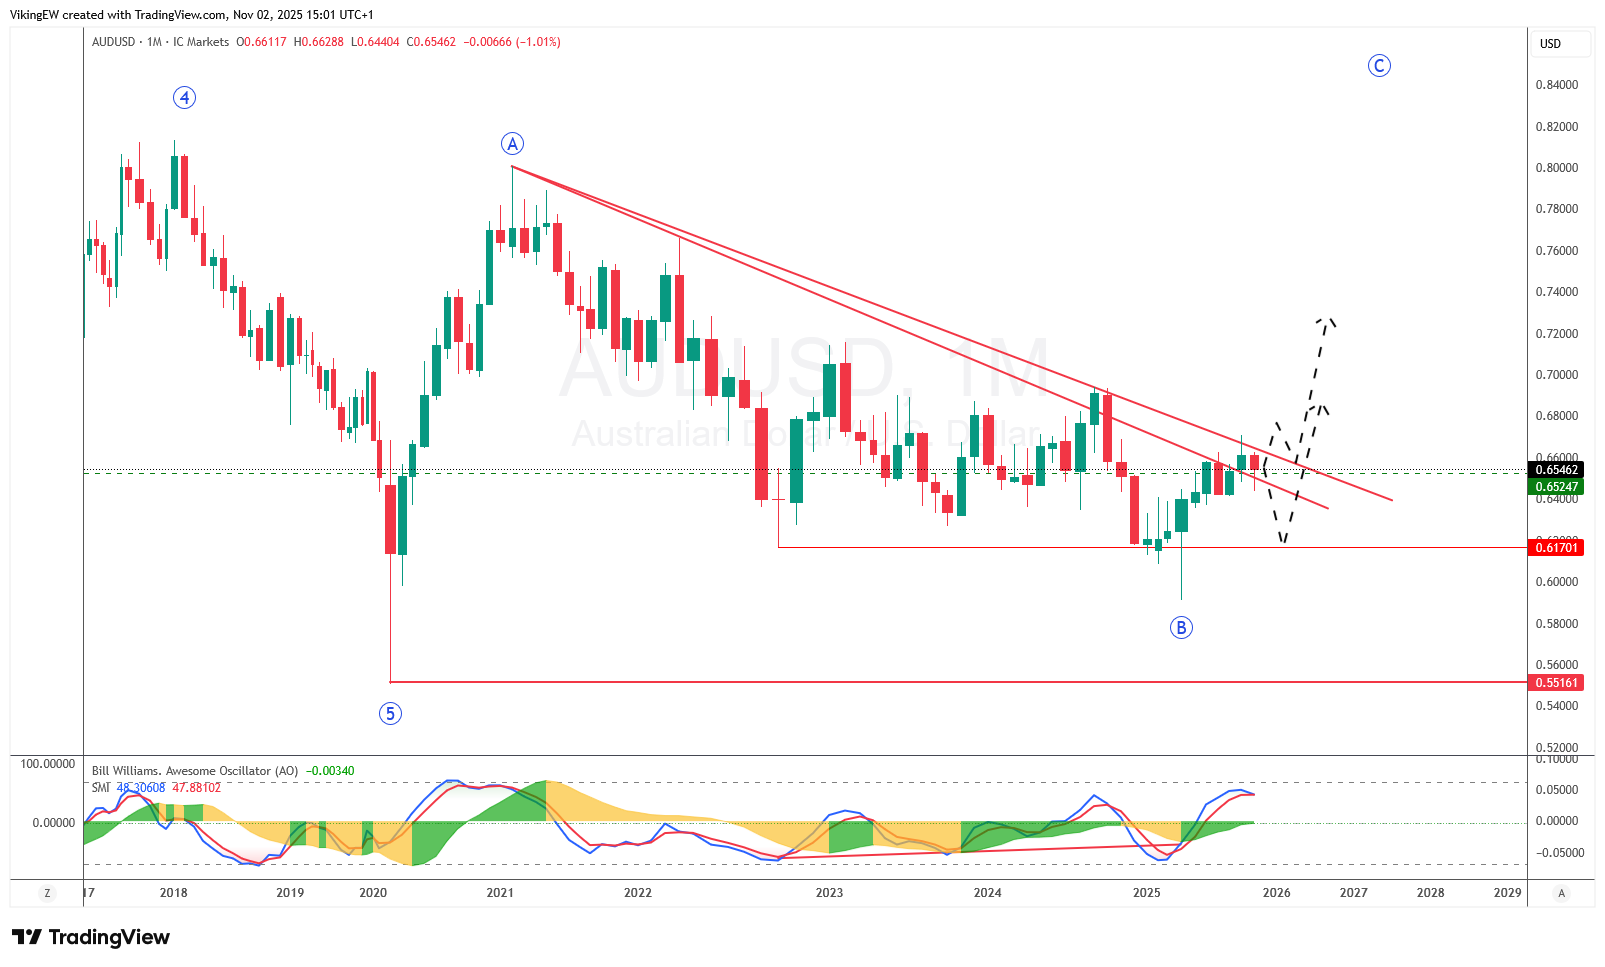
The Monthly chart for the pair also seems to be a bit inconclusive, as we have two equally sized candle bodies, with wicks pointing in the “wrong” direction based on the candle color and it’s all trapped between 2 diagonally sloping trendlines.
We have a RBA meeting on Tuesday, which may have the sway to break this deadlock and my thinking here is… The RBA is expected to hold rates, and may even talk hawkish but that could be just what’s expected so we could get a shorter term sell-off here, maybe not as deep as I drew it on the chart as that’s more of a maximum level for support as longer term I expect the pair to go higher.
EURUSD
Last week looking at this pair I was expecting a final wave 5 of (C) to complete as an Ending Diagonal, but that didn’t transpire as instead the pair sold off in response to Powell and FOMC. The Monthly chart below shows the consequences of that.
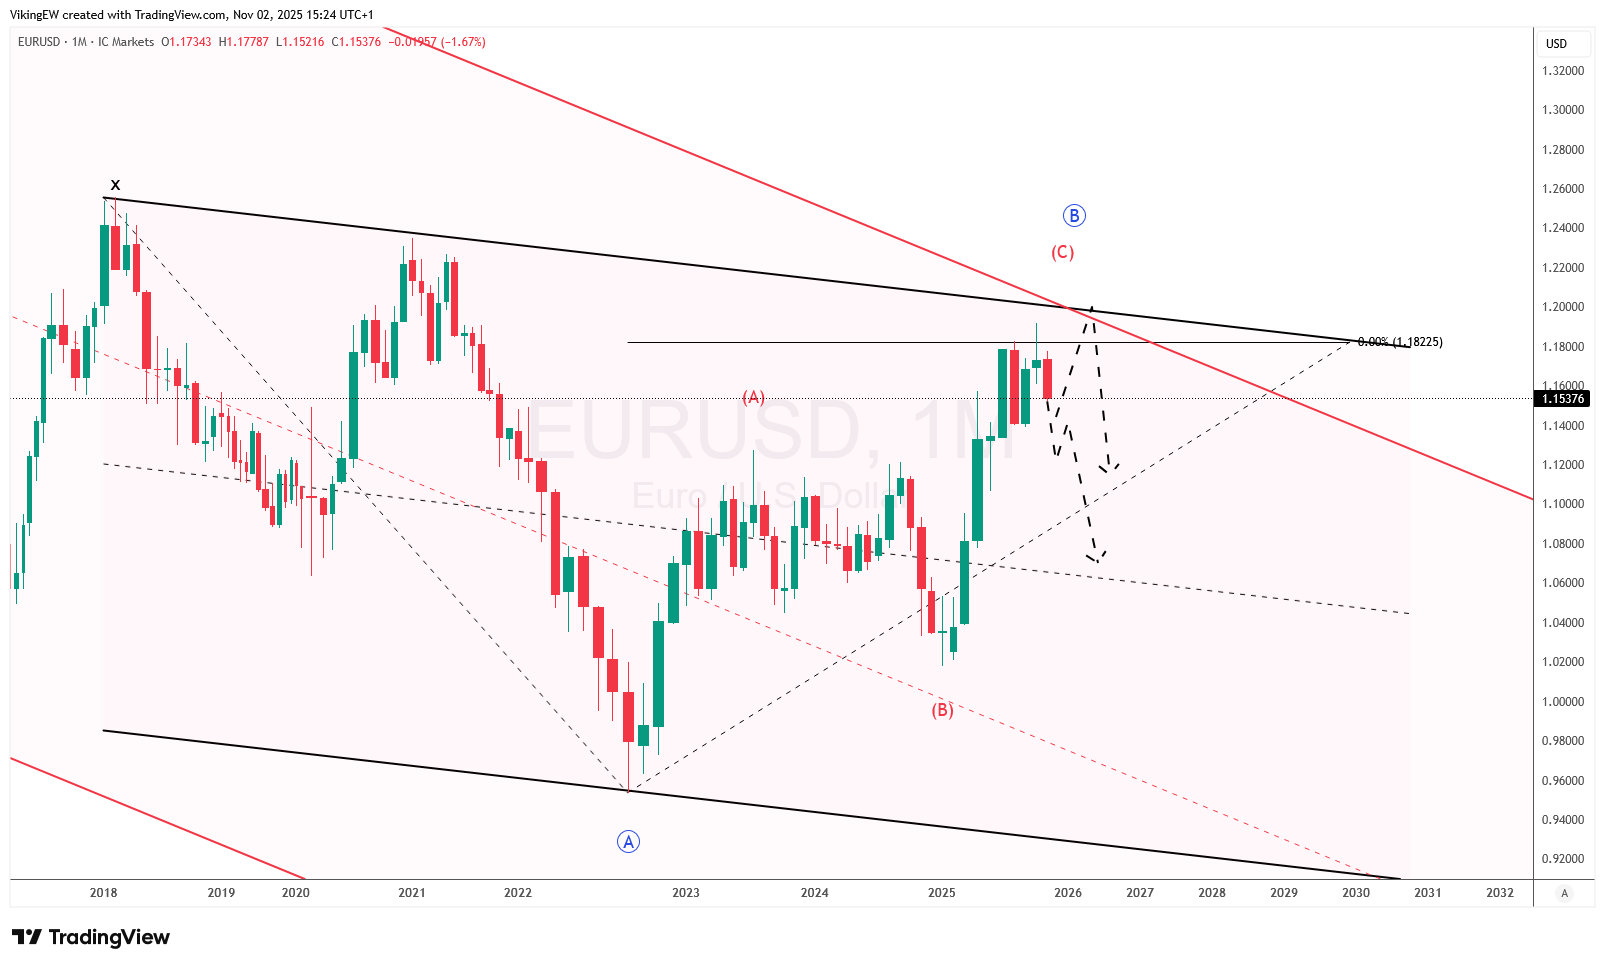
In fact, it was hinted at already with Septembers candle, which was a clear rejection of a continues move higher. Now I have to say that I’m not absolutely sure about this sell-off being it, because I don’t buy into Powell’s “hawkishness”, not at all. He “made it” sound hawkish but in reality, based on that he hasn’t got any more data than anyone else, it just means “we set rates meeting to meeting, as always, not pre-comitting as always”
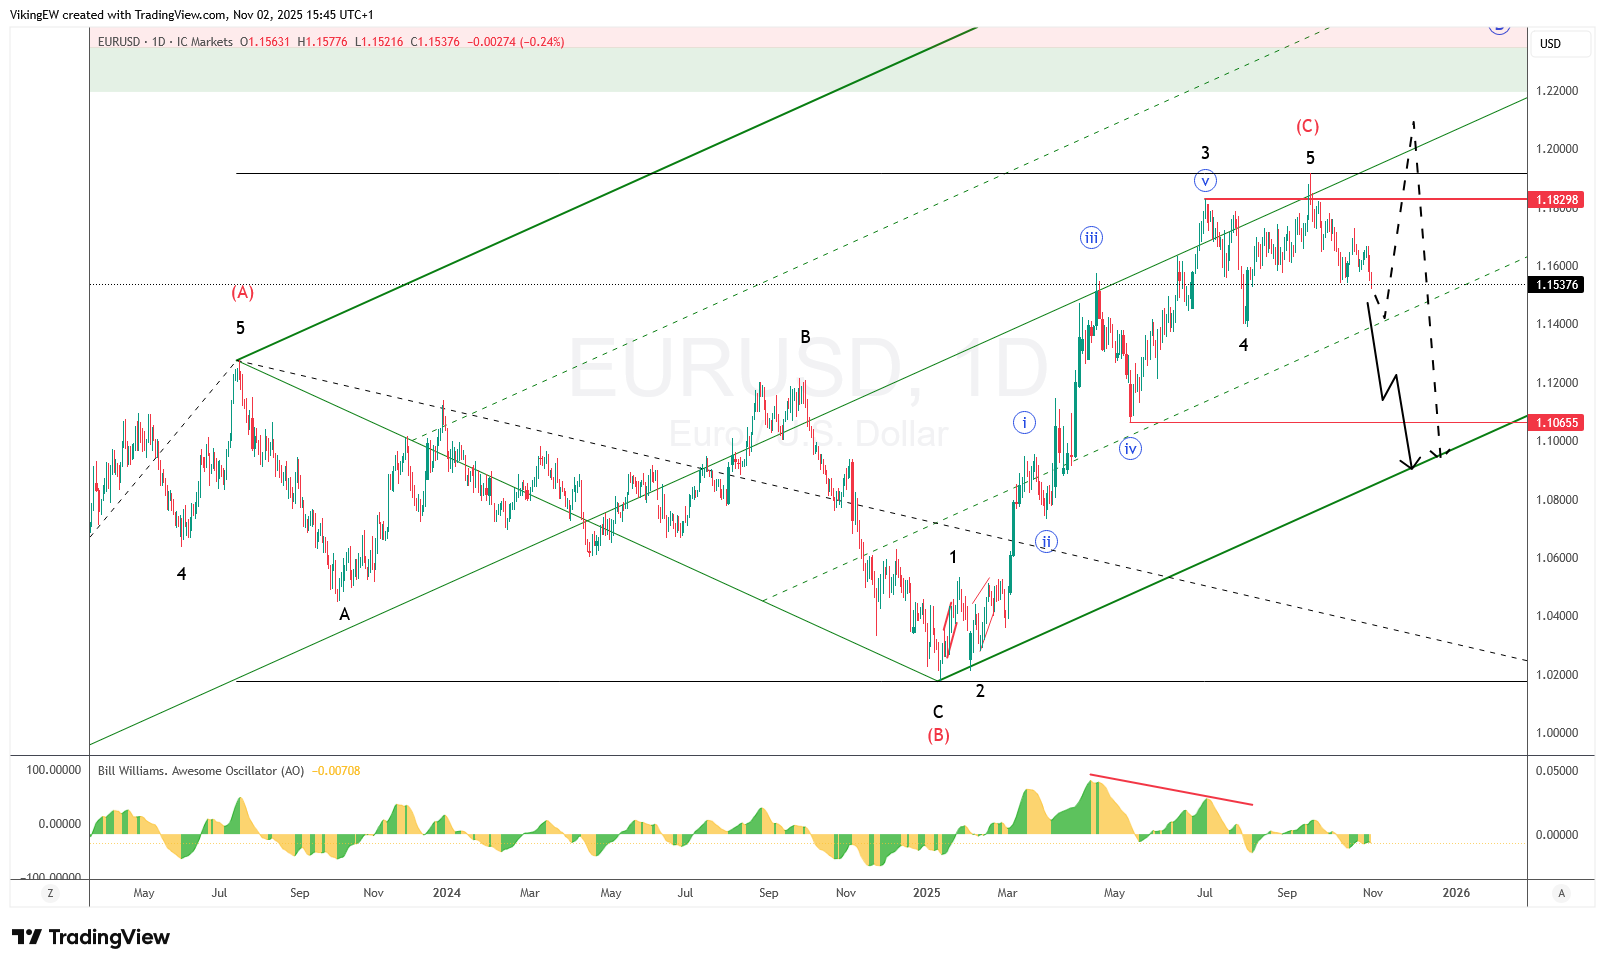
However, with or without the Fed’s impact on the greenback, it’s still possible to count the last move up in 5 waves. Having said that, though, what has followed thereafter is not a clear cut impulsive move looking at the Daily timeframe but it’s not uncommon that wave 1 is tentative, not at all. Thus my view is to wait to see if 1.14 will be tested and if it holds or not, of if we will see a new impulsive move high of if it can be identified as a correction.
GBPUSD
October didn’t do any good to the Pound, and while that has underpinned the bearish move in this pair, it has also arrived at what could or should be strong support. The UK budget later in November will have impact here and while there is still room to the downside I think it’s limited as the overall pattern here still points higher, in due time.
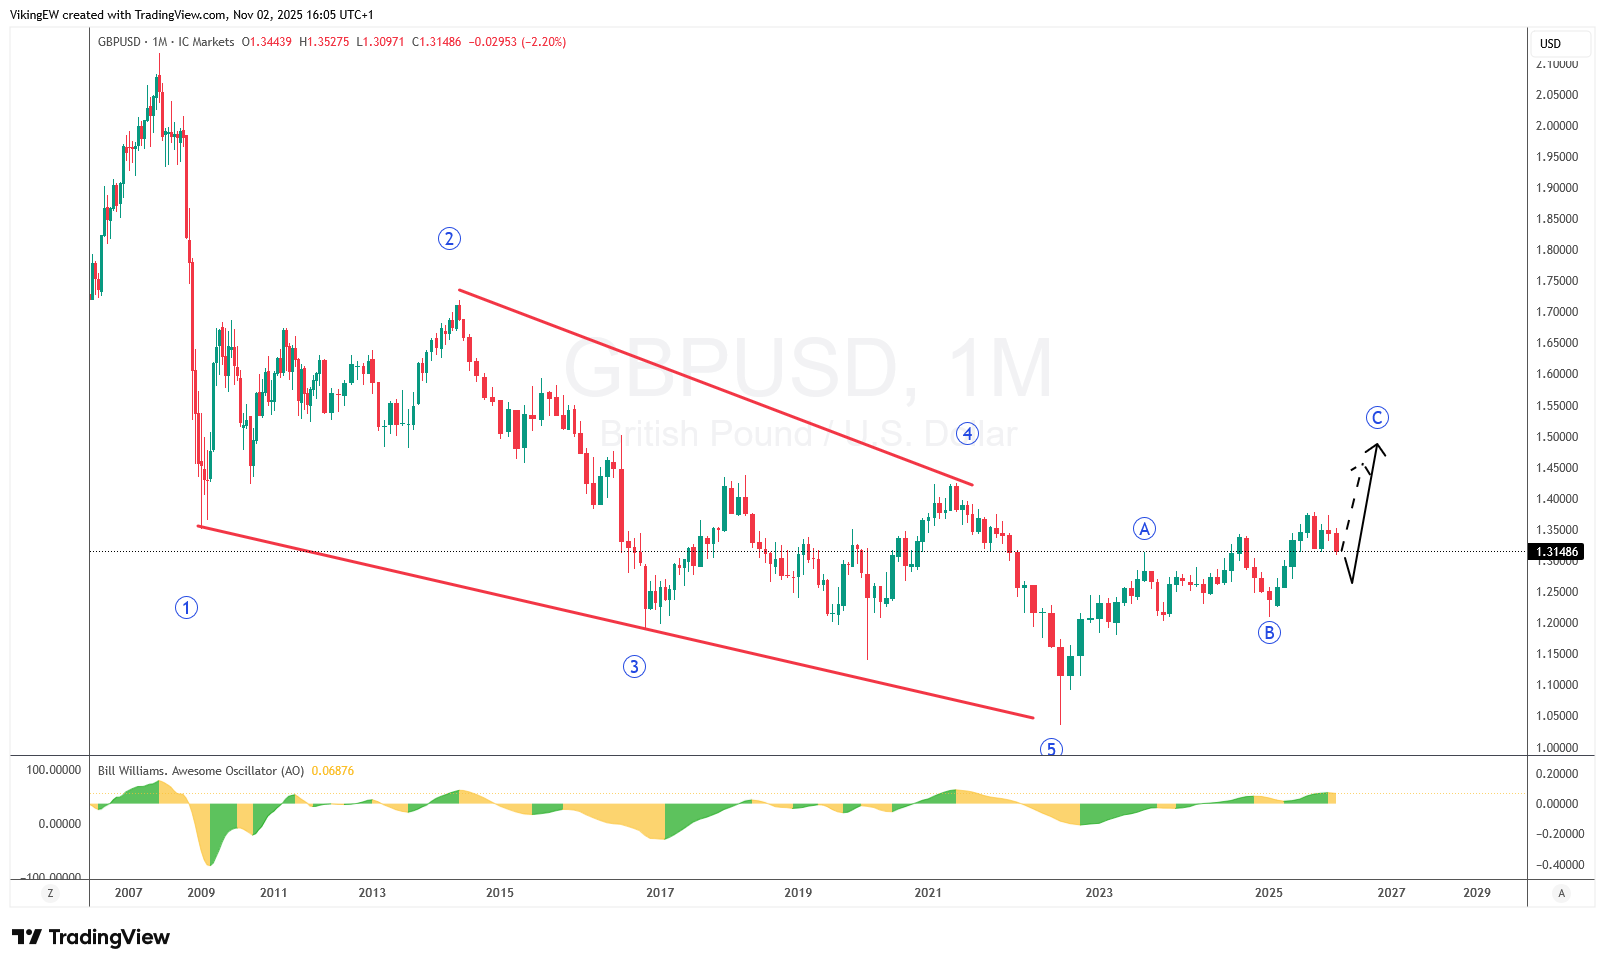
However, near term and from a technical perspective, it doesn’t look totally hopeless for Sterling. Simply, the move lower from the high hasn’t been impulsive directly but played out in waves of three. Originally, I was thinking a triangle here, but that was invalidated as price moved below wave a
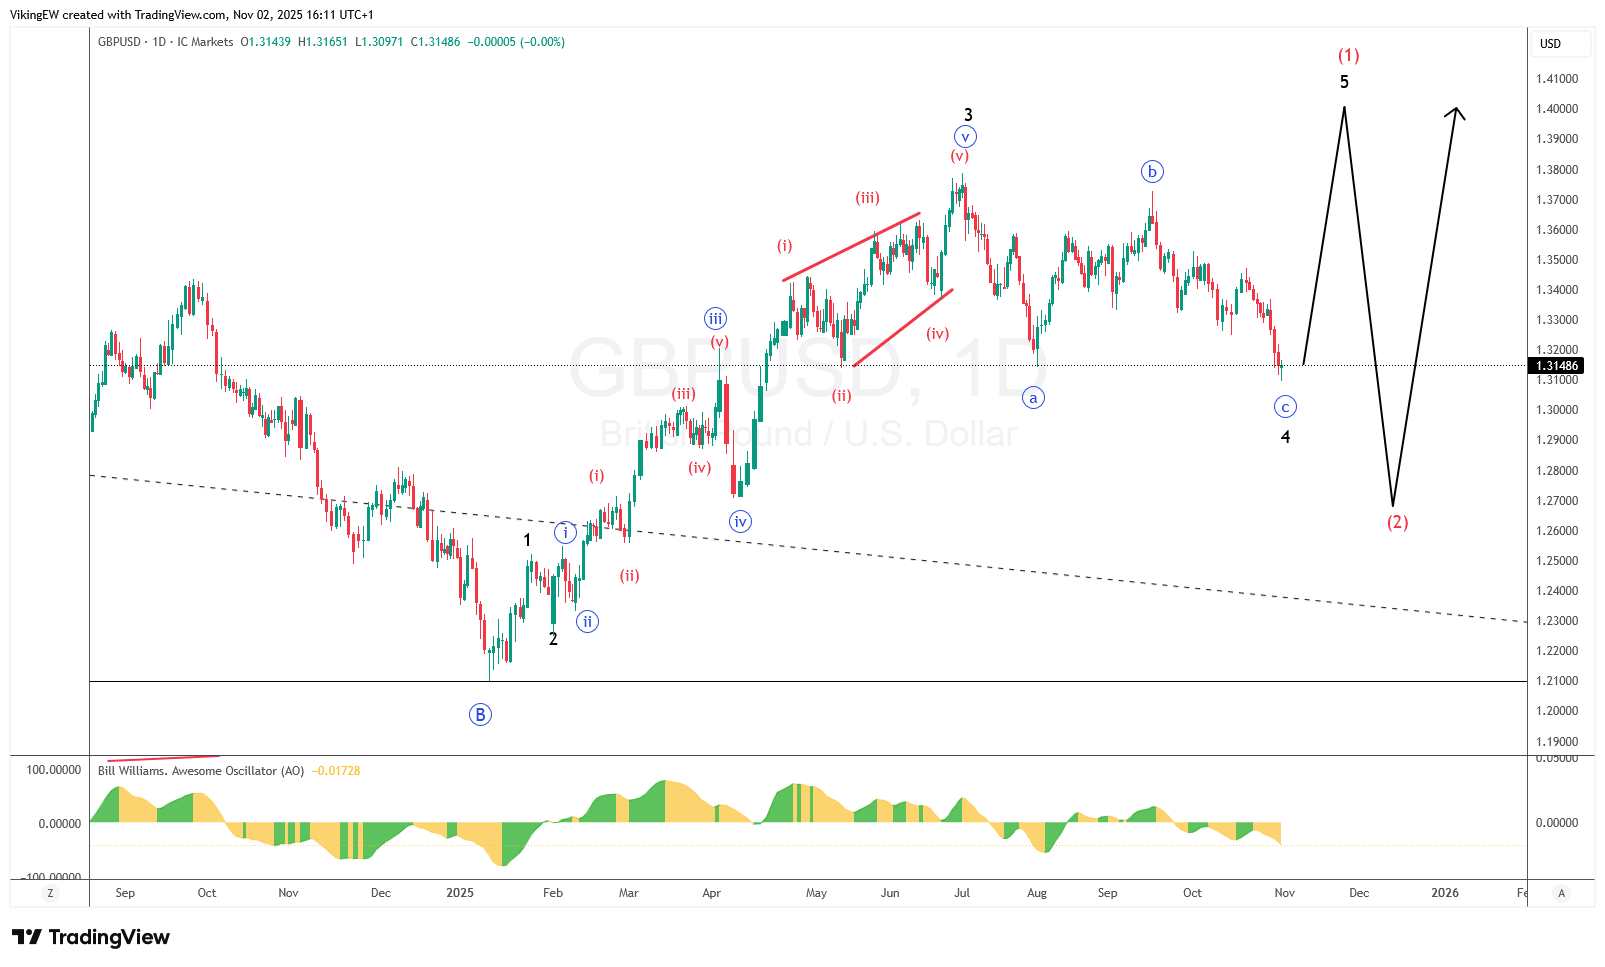
It still looks as if it could be wave 4 though, so I wouldn’t be surprised if we will see a move higher next into wave 5 or (1), and then there will be a somewhat deeper correction, possibly sharp as often is the case with wave 2.
USDCAD
The Monthly USDCAD chart has a nice corrective structure, as it climbs in a Pitchfork channel.
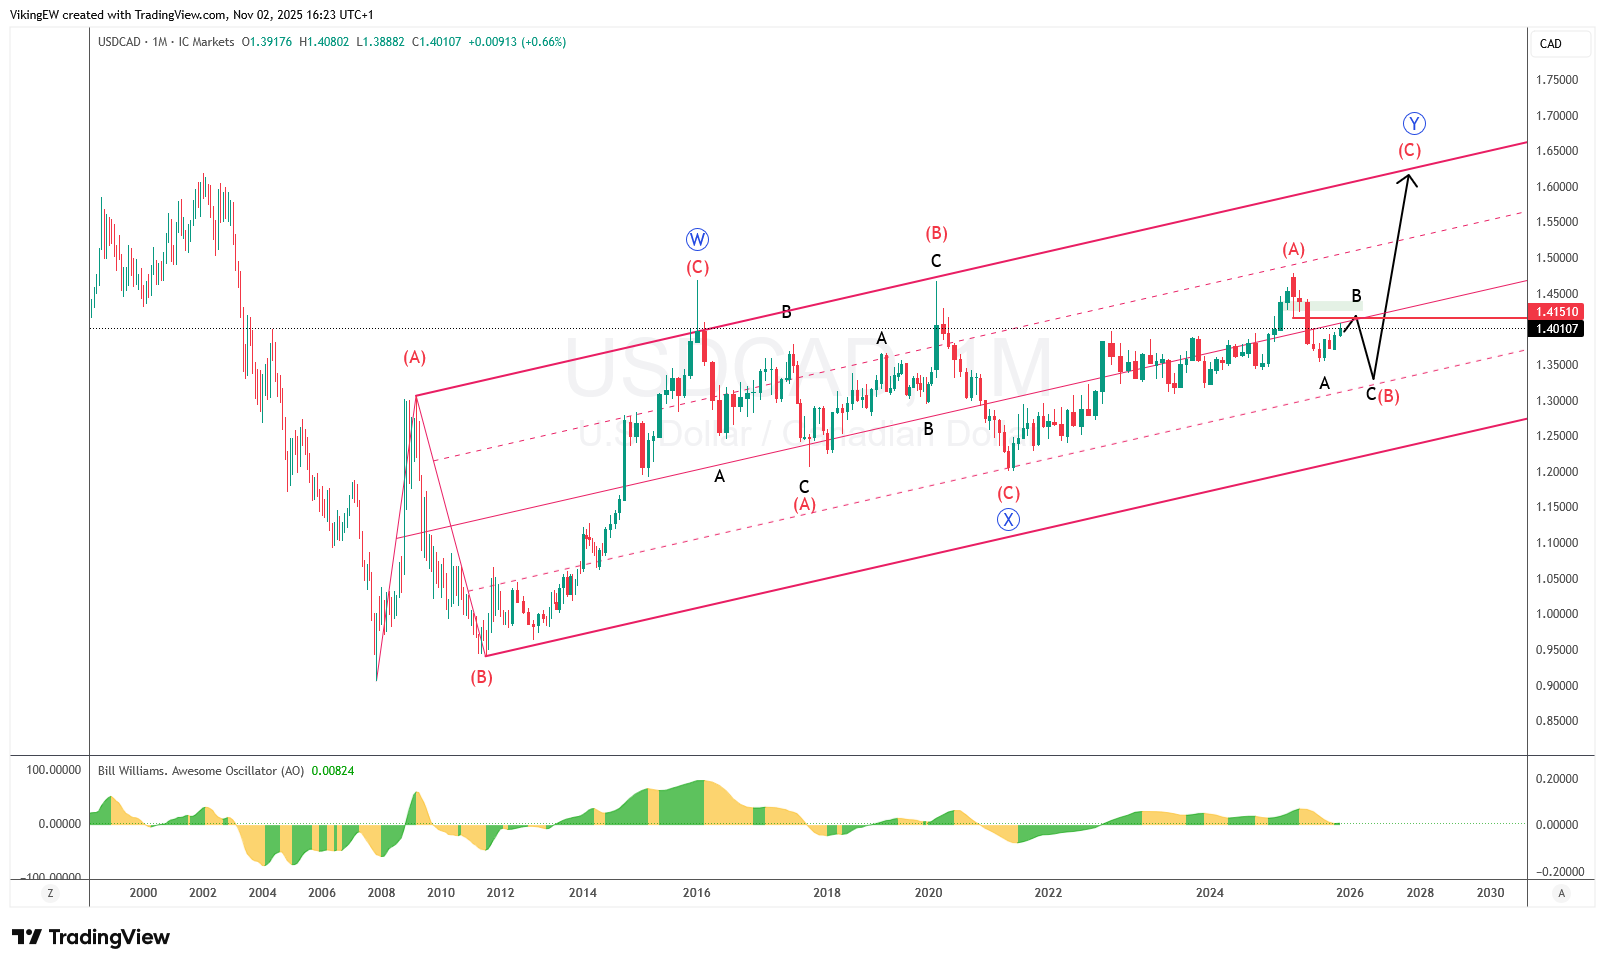
Eventually, I think this will end in the 1.60-65 area, if the channel stretches out all the way, but there is room for a deeper correction towards 1.35 first, before the final move higher.
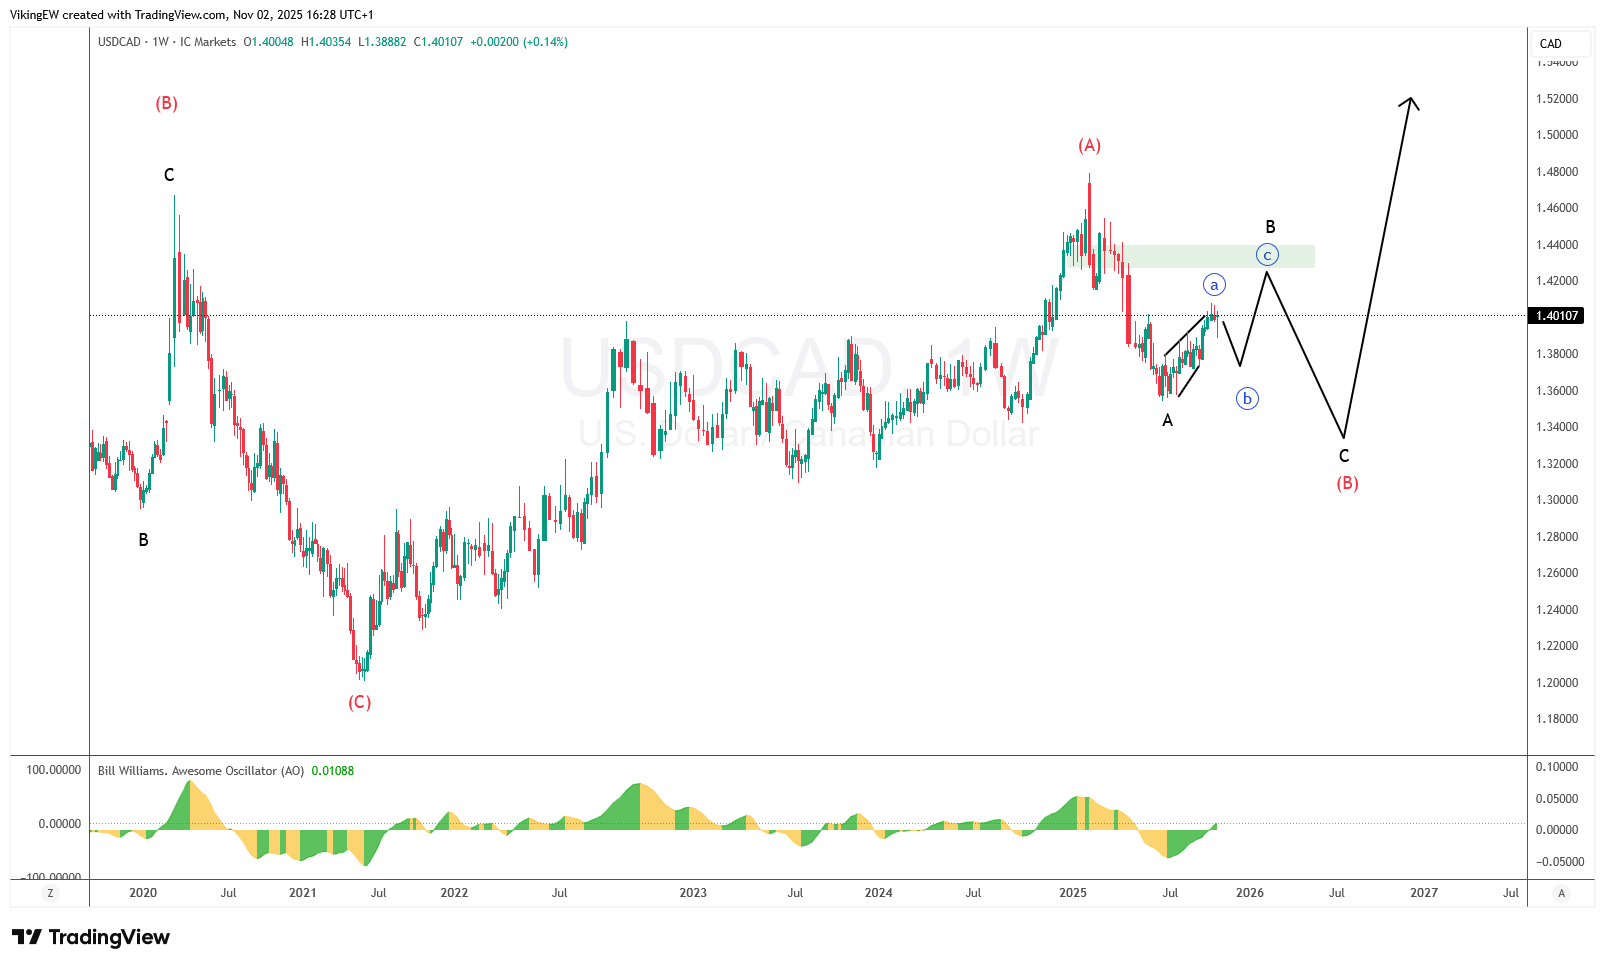
The ongoing diagonal drawn on the weekly chart, may have completed, despite the strong recovery last week, as that type of “hanging man” candle usually isn’t bullish at all, but no rule without exception. In short, no one knows what will happen next week, for sure.
USDCHF
Last week I aired the idea that wave 5 and a bottom may be in place for this pair and while it’s not confirmed, yet, nothing has transpired against it so far.
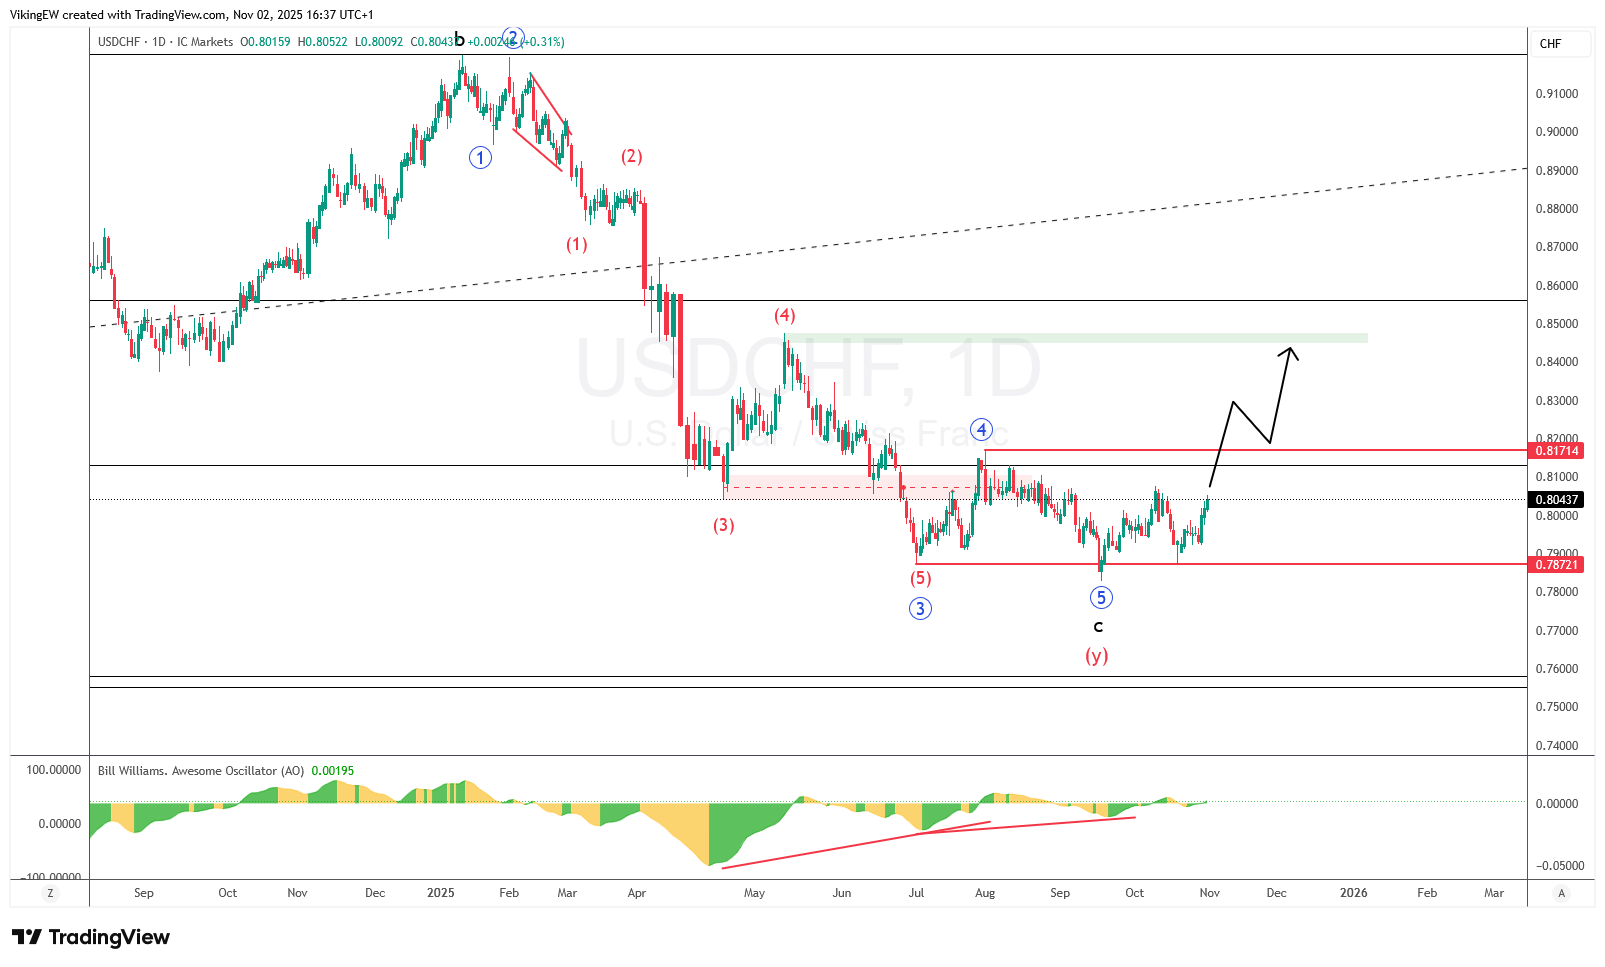
The monthly chart below can’t give a decisive answer about it, of course as technically, this pair is still in a strong down trend on this time frame.
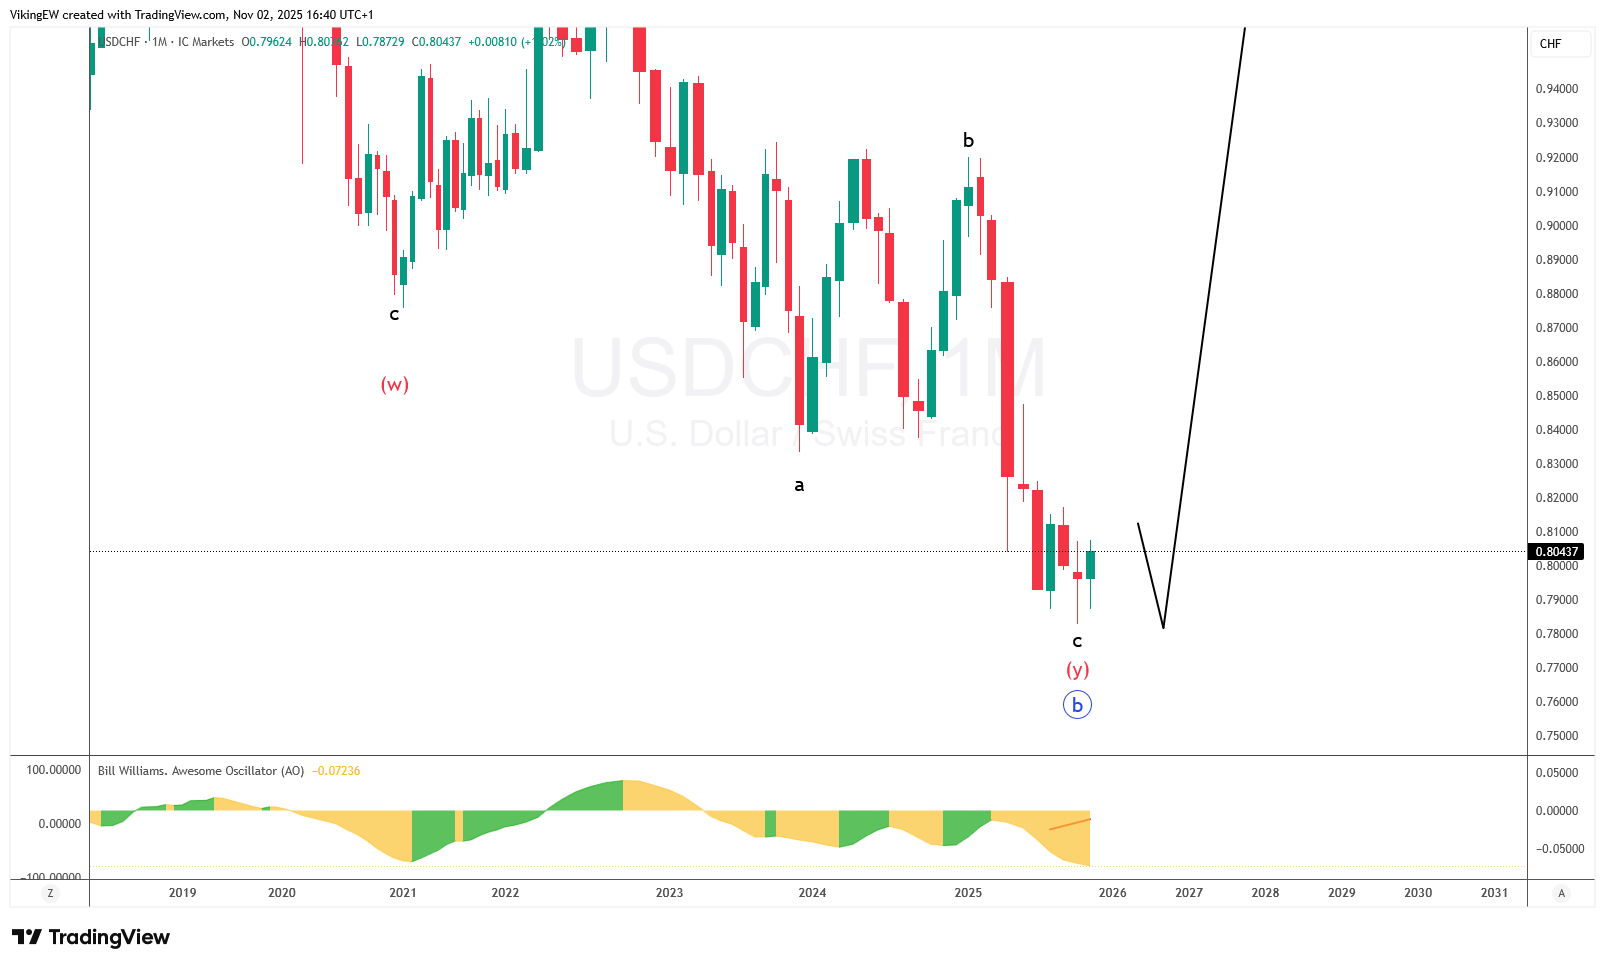
There are signs, though, we would like to see in case there is a reversal playing out. Like the small bodied candle with a deep wick on the downside, even if the somewhat shorter wick on top counter that a tad. That was September though and October then trumped that wick, even if the close didn’t come above. If price moves above next, but more so above the next red candle, then we certainly can start to talk about a reversal.
USDJPY
I don’t really has to say much here and th etext is appraoching email max anyway. The monthly chart is clear and for more about the JPY read my latest FX-Basket Update #29
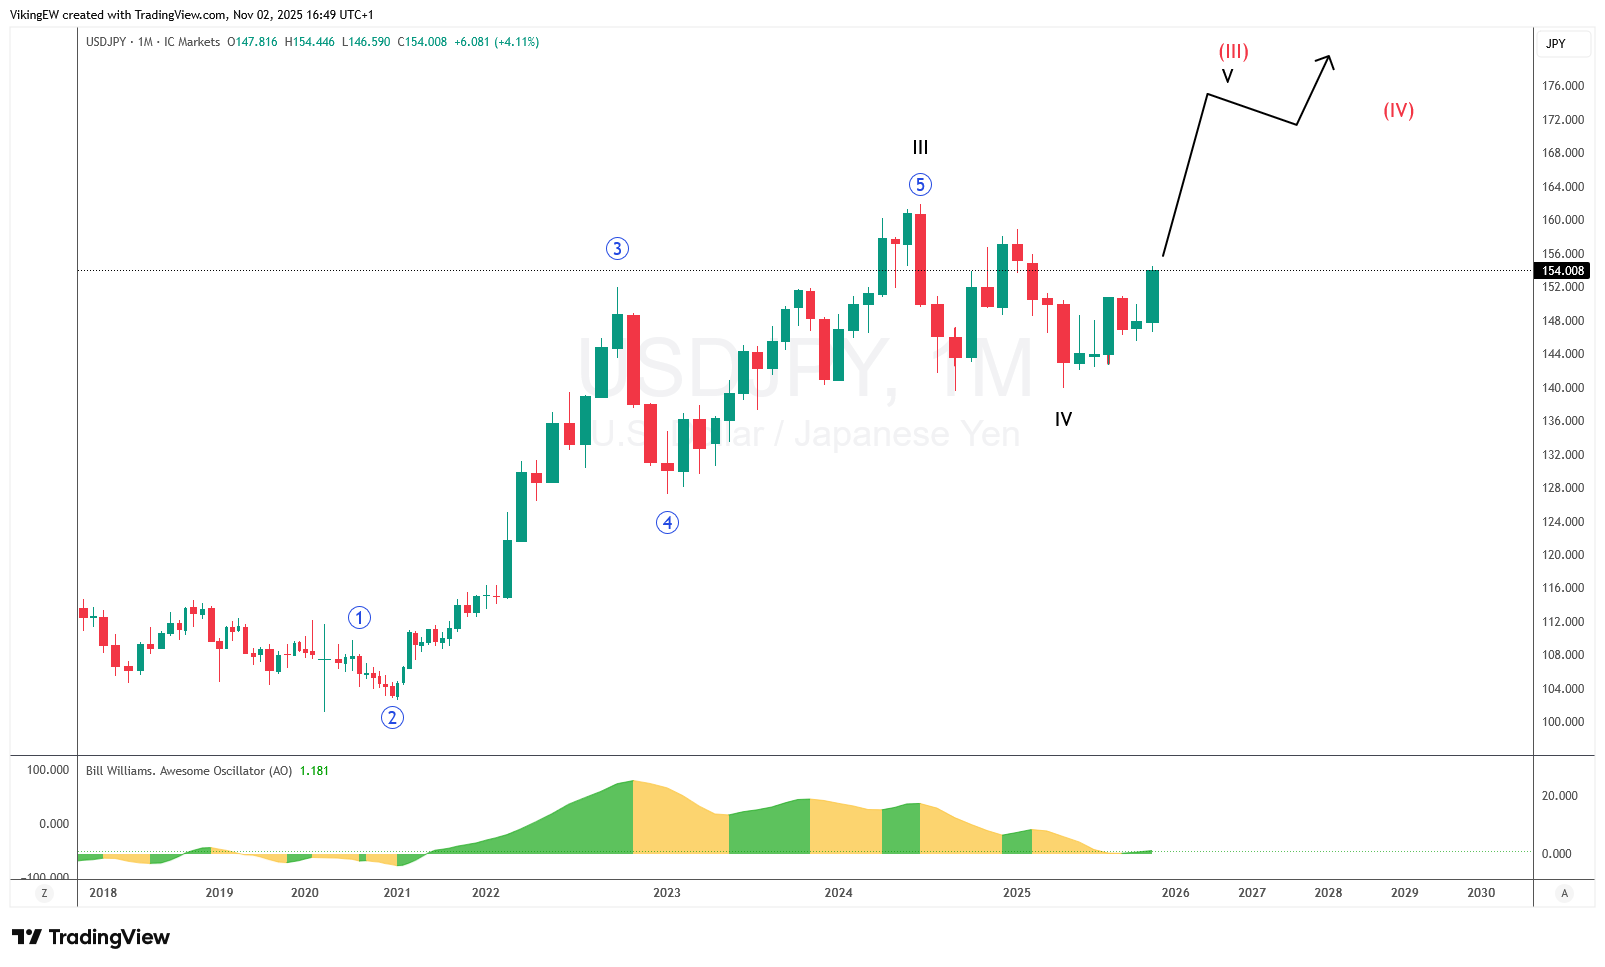
Of course, nothing moves in a strait line, not even the Yen, and neither of the two involved will be happy with this but… this is the “reflecting fundamentals” that BOJ often talks about.